By the end, you should be able to explain an application through its problem, data, method, evaluation, and use.
1. Basic Concepts
What Can AI Systems Do?
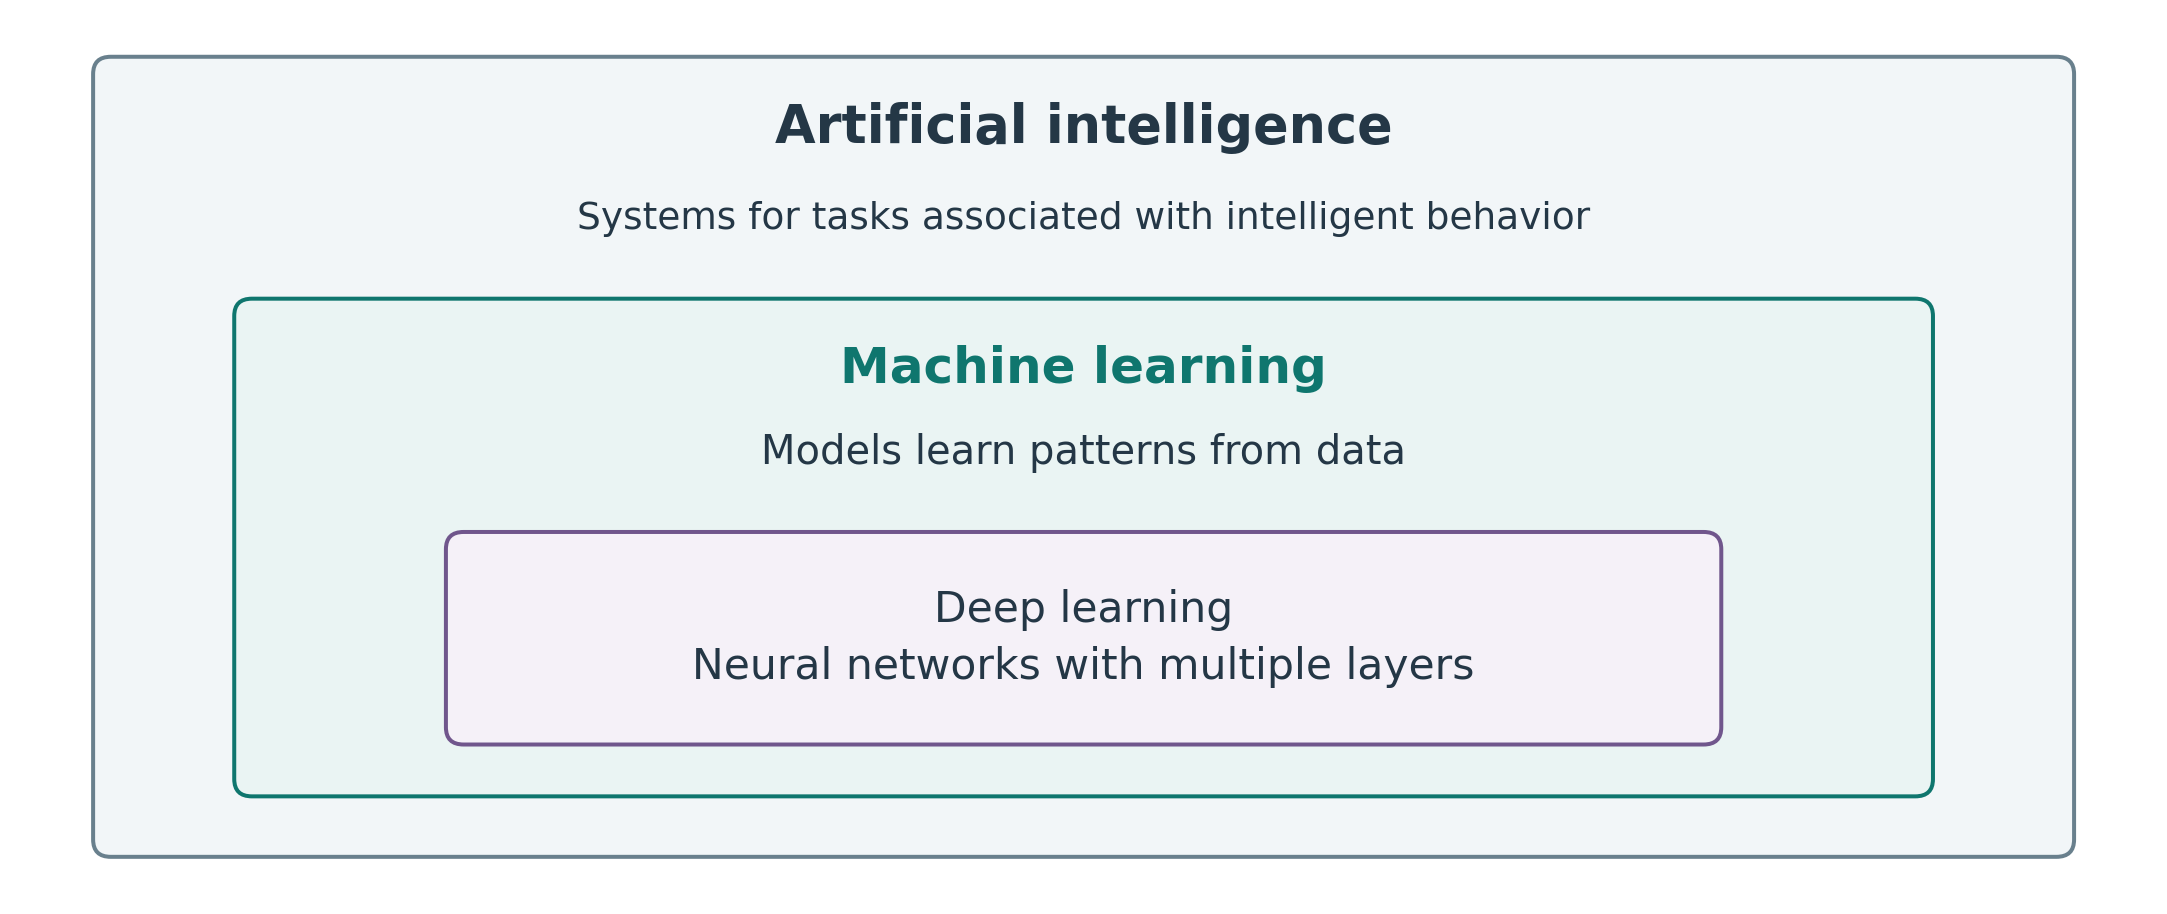
Artificial intelligence is the field of building systems that perform tasks associated with intelligent behavior.
An AI system can make mistakes. Its output needs evaluation in the setting where it will be used.
Capability
Example
Perceive
Identify a defect in an image
Predict
Estimate a machine’s remaining useful life
Reason
Combine facts and rules to assess possible causes
Generate
Produce a candidate design or a draft report
Support decisions
Recommend which equipment to inspect
AI, Machine Learning, and Deep Learning
Choose the method according to the task, available data, and practical requirements.
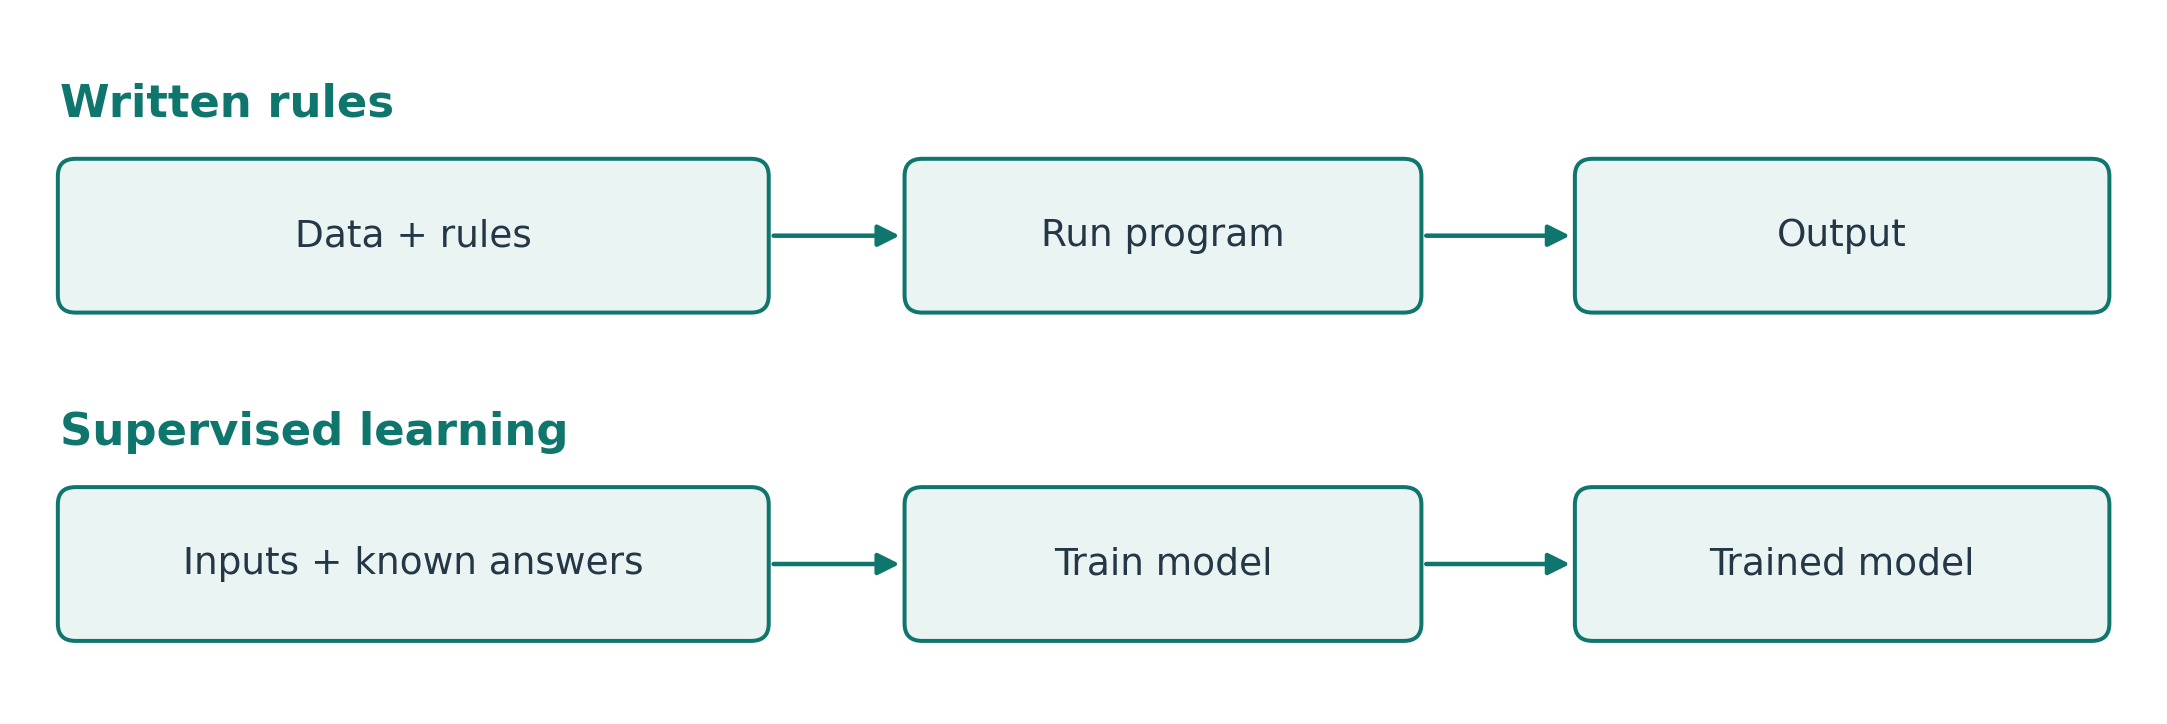
Rules and Learning From Examples
Written rule: flag a pump when its temperature exceeds a set limit.
Learned model: use past sensor readings and failure records to estimate failure risk.
This learning example is supervised learning: the training data includes known answers.
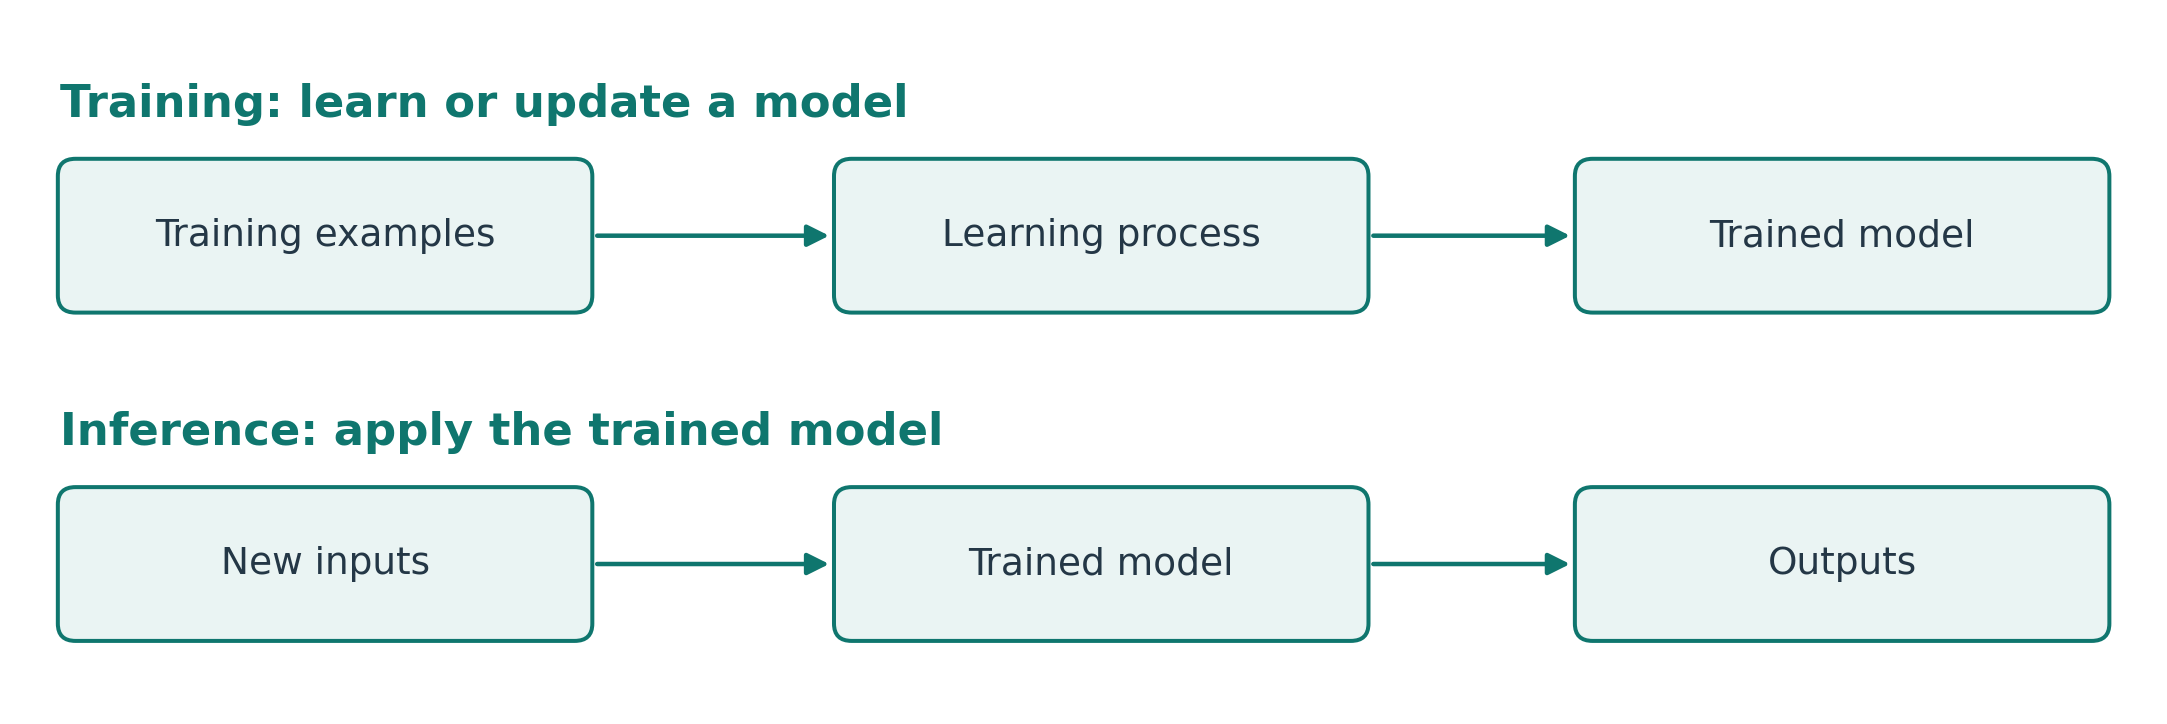
Training and Inference
Training: learn or update a model from data.
Inference: apply the trained model to an input.
Models may be retrained. Inference may run immediately or in scheduled batches.
Common Tasks in Applied AI
One setting—a factory—can involve several tasks:
Task
Purpose
Factory example
Regression
Predict a number
Estimate product strength
Classification
Assign a category
Label a product as defective or acceptable
Forecasting
Predict future values
Estimate next week’s electricity demand
Anomaly detection
Identify unusual patterns
Flag unusual pump vibration
Generation
Produce candidate outputs
Propose a component design
Optimization
Search for the best feasible option
Select operating settings
Define a Useful AI Task
Start with a practical need: reduce unplanned pump downtime.
A concrete task statement:
Estimate whether a pump will fail within the next 24 hours, using recent sensor readings, so a maintenance planner can prioritize inspections.
This names the output, time horizon, data, and user.
Quick check (1 minute): what task type is this, and what past records would be needed?
2. From a Model to a Working System
Connect the Output to a Decision
For the pump example:
Output: estimated failure risk within 24 hours
User: maintenance planner
Action: review the alert and schedule an inspection
Value: fewer unexpected stops, with a manageable inspection workload
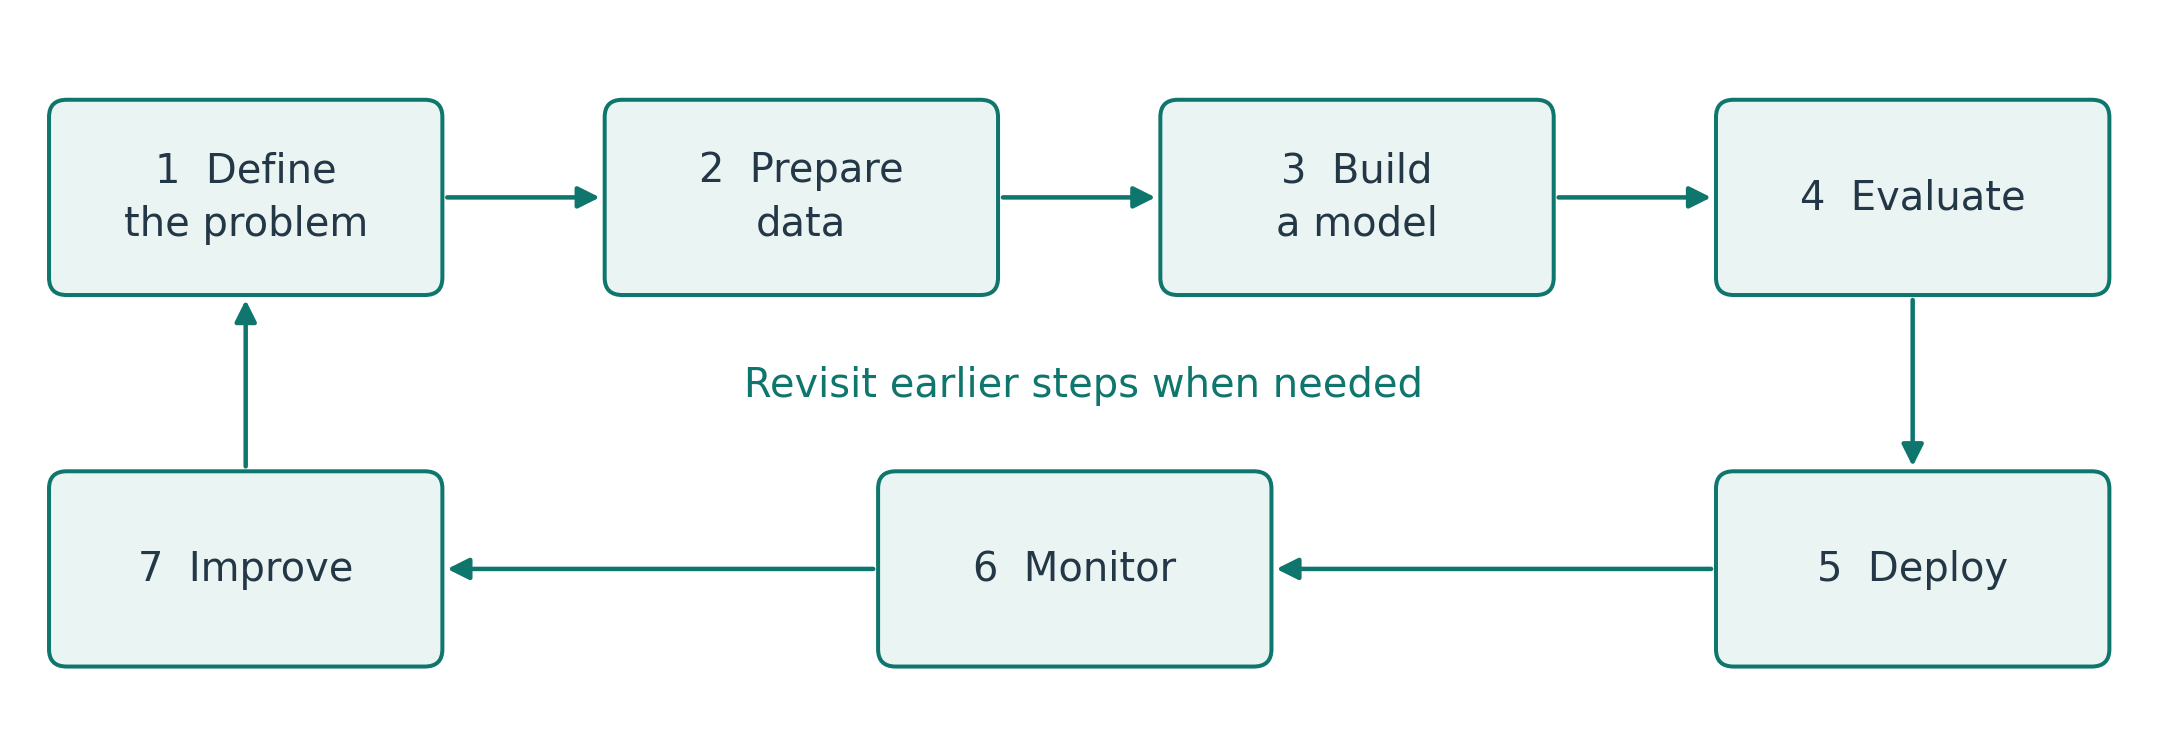
The Applied AI Lifecycle
Deployment puts a model into use. Monitoring checks its behavior after deployment.
Return to earlier steps when the data, requirements, or results change.
What Data Does the Task Need?
Labels are needed for supervised learning. Other learning approaches may use unlabeled data.
Question
Pump example
Features: what inputs are available?
Recent temperature, vibration, and load
Labels: what answers are known?
Whether failure occurred in the next 24 hours
Quality: are records reliable?
Correct timestamps and working sensors
Coverage: what conditions are represented?
Different pumps, loads, and seasons
Data Has Different Forms
Structured data: values organized in fields, such as a table of sensor measurements.
Unstructured data: content such as images, free text, and audio.
Sequential data: observations with a meaningful order, such as readings over time or depth.
These descriptions can overlap: a table of hourly readings is both structured and sequential.
The data’s form helps determine how to prepare it and which models to consider.
Evaluate the Model and the Application
A baseline is a simple method used as a reference for comparison.
For a pump warning system, check:
Prediction quality: how many failures are detected or missed?
Comparison: does it improve on a simple temperature rule?
Practical use: are warnings early enough and false alarms manageable?
New conditions: does it work on data representative of future use?
Use separate data for training, validation (model selection), and testing (final evaluation).
Why High Accuracy May Be Misleading
Suppose only 5 of 100 examples contain a failure.
A system that always predicts “no failure” has 95% accuracy, but detects none of the failures.
Even a model with useful predictions can fail in practice if:
its output arrives too late;
users cannot check or act on the result;
operating conditions change after deployment.
Choose measures that reflect the purpose of the application.
3a. Case Study: Engineering Design
Agung Nugraha, Hyerin Kwon, Gyeongho Park, and Jihwan Lee (2025). “Cooperative neural networks for inverse design: Integrating denoising autoencoder and surrogate model for partial design variable imputation.” Engineering Applications of Artificial Intelligence, 162, 112453. doi:10.1016/j.engappai.2025.112453.
The Problem: Glass Run Channel Design
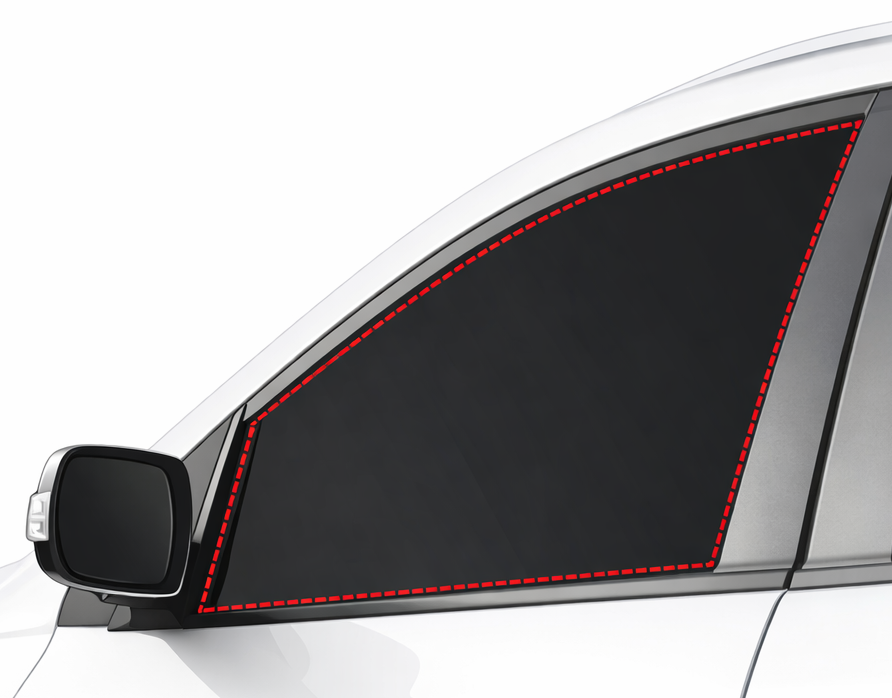
A glass run channel guides and seals a car’s moving window.
Some design dimensions are already fixed.
Engineers must choose the remaining dimensions.
The complete design must satisfy performance requirements.
Task: propose the remaining values while keeping the fixed values unchanged.
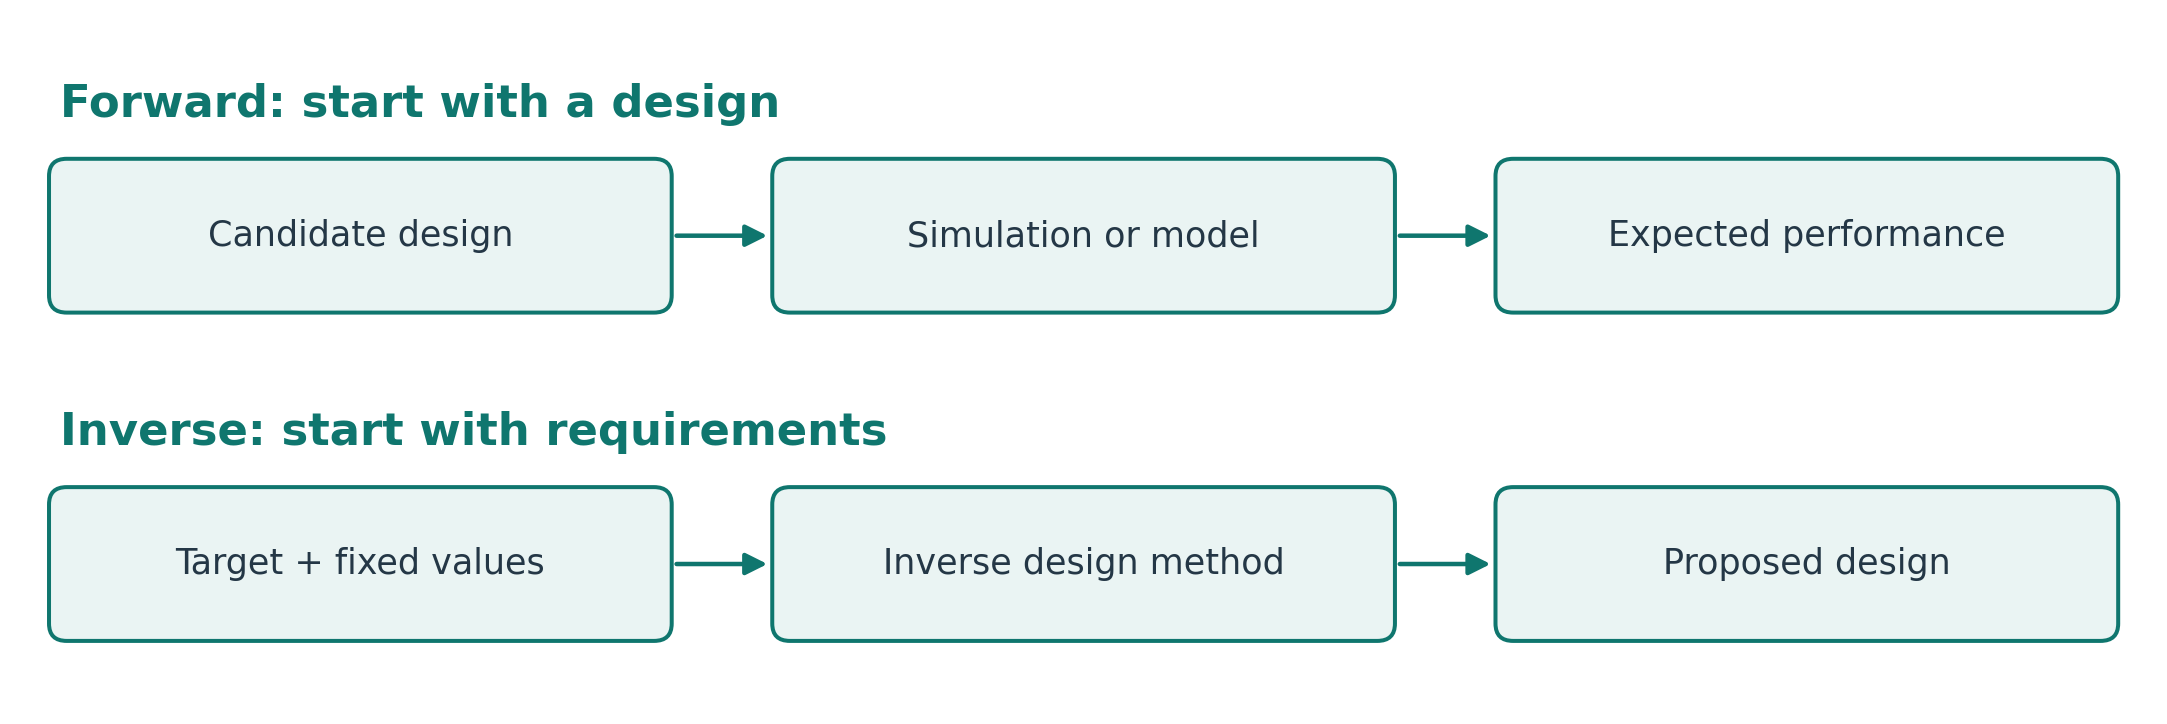
Forward Prediction and Inverse Design
Forward: what performance will this design produce?
Inverse: what design could achieve this performance?
An inverse problem can have several solutions—or no feasible solution. A proposed design still needs validation.
Partial Inverse Design
Partial inverse design chooses only the free design variables while preserving the fixed ones.
The study treats the free variables as missing values to estimate.
Imputation means estimating missing values from the available information.
Illustrative example:
Given
To be estimated
To be checked
Fixed dimension A and target performance
Free dimensions B and C
Does the complete design satisfy the requirements?
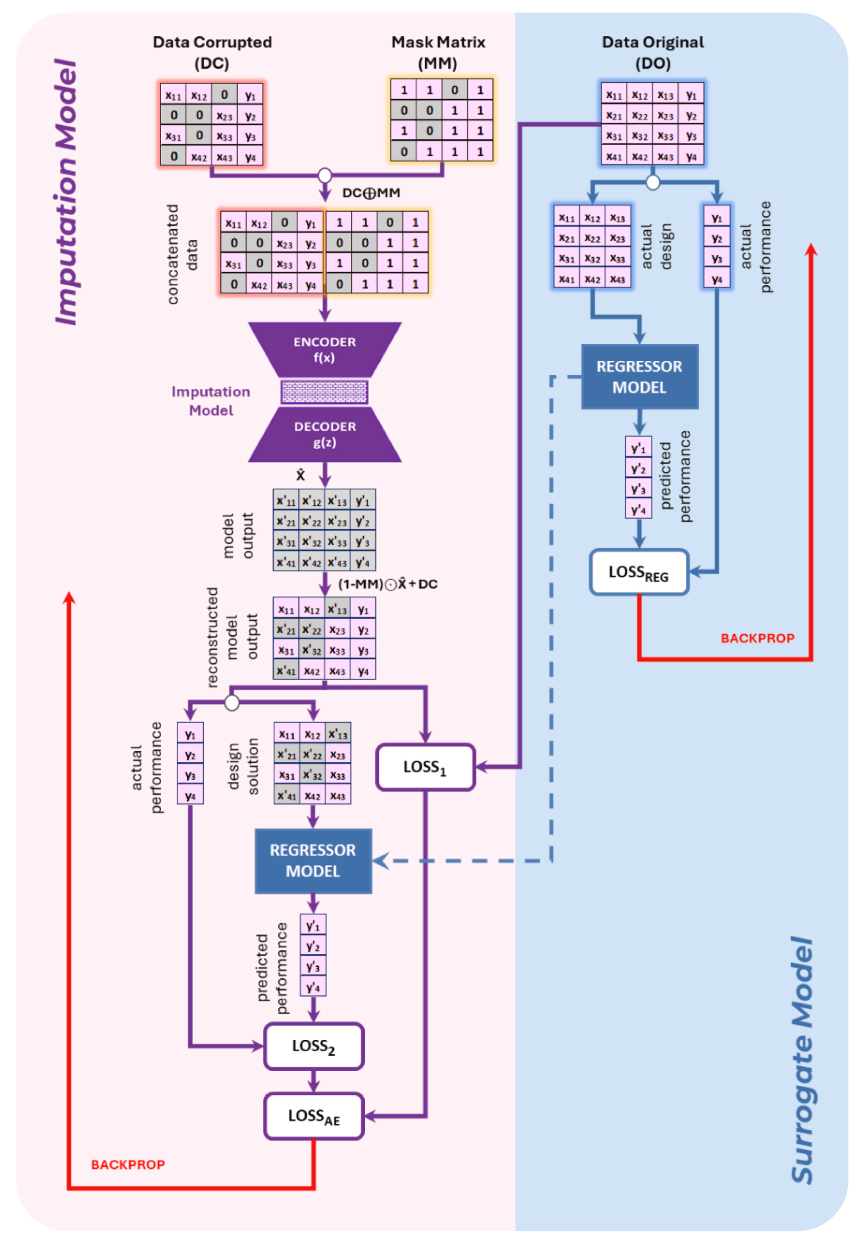
The Approach: Two Cooperating Networks
Imputation model: proposes the missing design values.
Surrogate model: estimates performance as a fast substitute for simulation.
Joint training: uses reconstruction and performance errors to guide learning.
Read the figure in two parts: the imputation model on the left and the surrogate model on the right.
Gian Antariksa, Radhi Muammar, Agung Nugraha, and Jihwan Lee (2023). “Deep sequence model-based approach to well log data imputation and petrophysical analysis: A case study on the West Natuna Basin, Indonesia.” Journal of Applied Geophysics, 218, 105213. doi:10.1016/j.jappgeo.2023.105213.
The Problem: Missing Well-Log Measurements
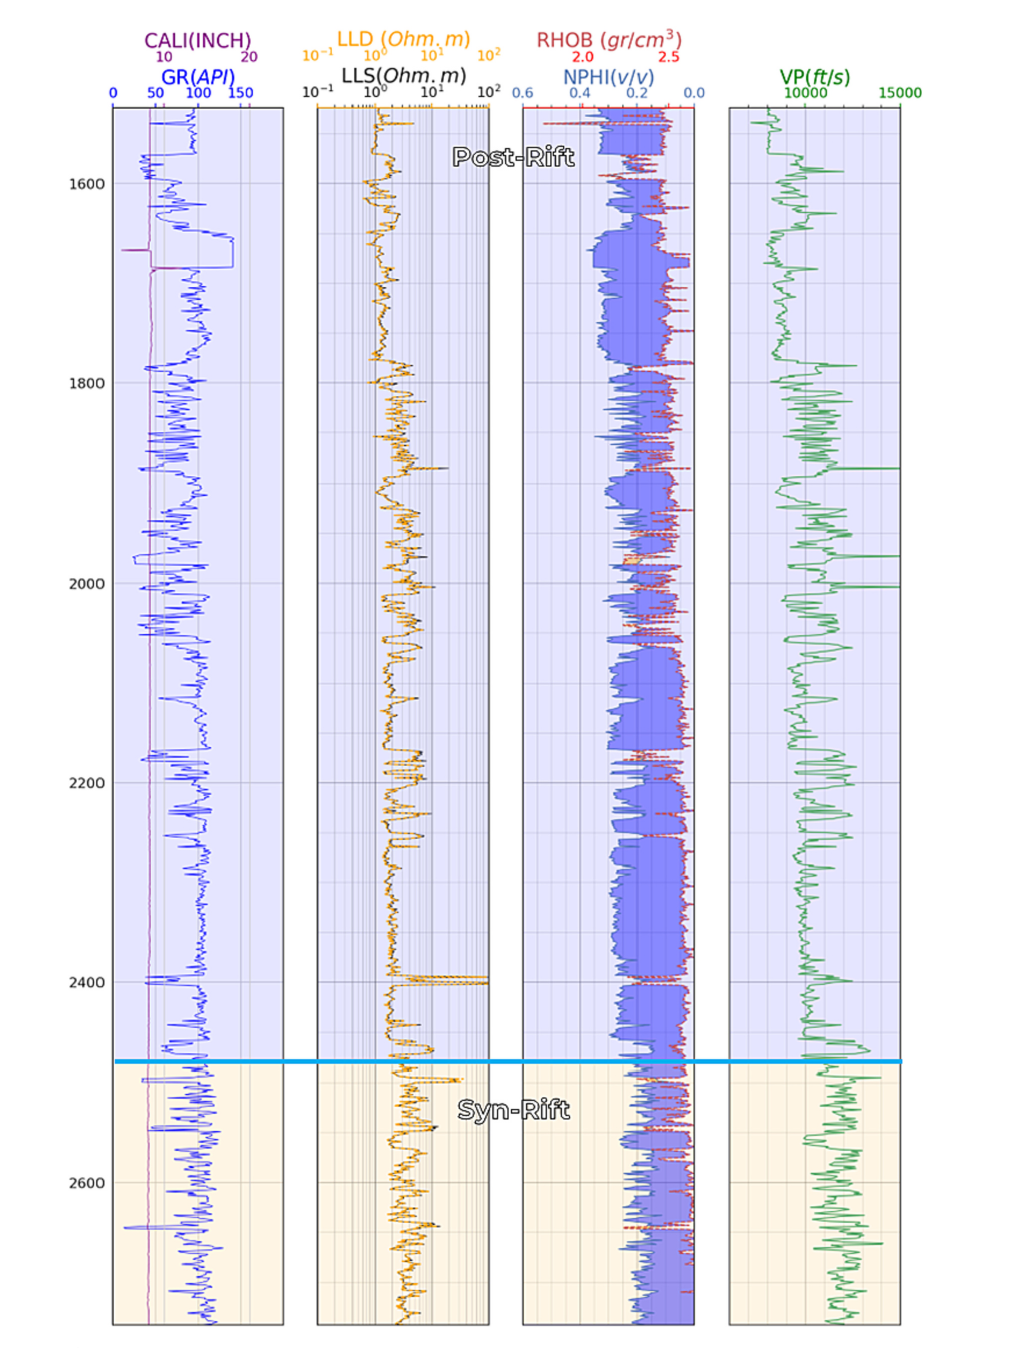
A well log records measurements along the depth of a drilled well.
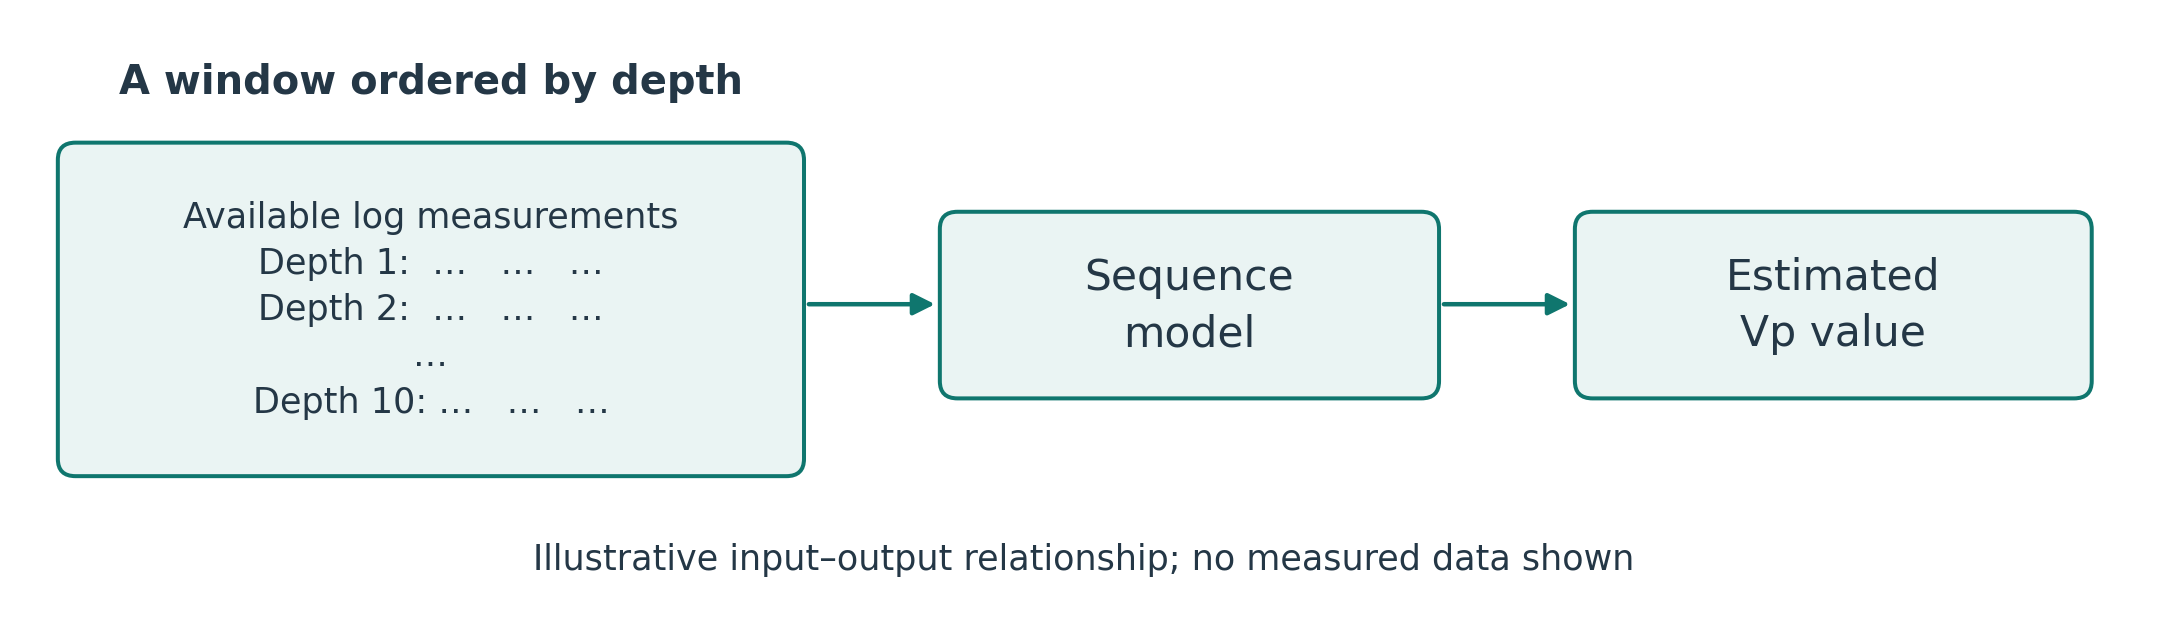
The study estimates missing Vp values: the speed of compressional waves through the rock.
Input: other available log measurements
Output: estimated Vp at the required depths
Use: support interpretation of reservoir properties