Lecture 3: Deep Learning for Structured and Engineering Data
From prediction to representations and modern modeling paradigms
Special Topics in Artificial Intelligence (STAI 2026)
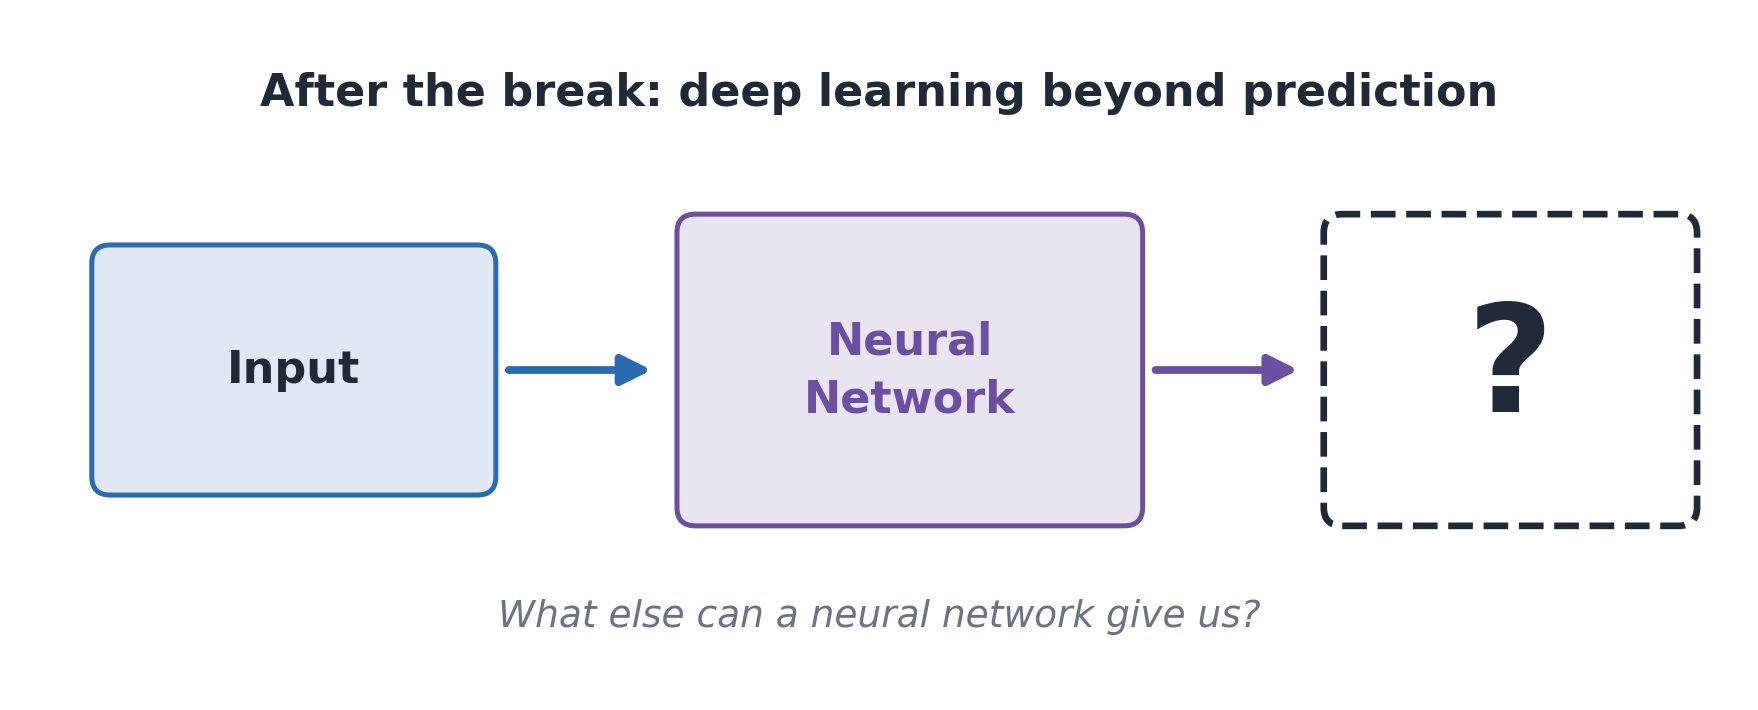
Three Questions for This Lecture
Today we ask three questions about neural networks:
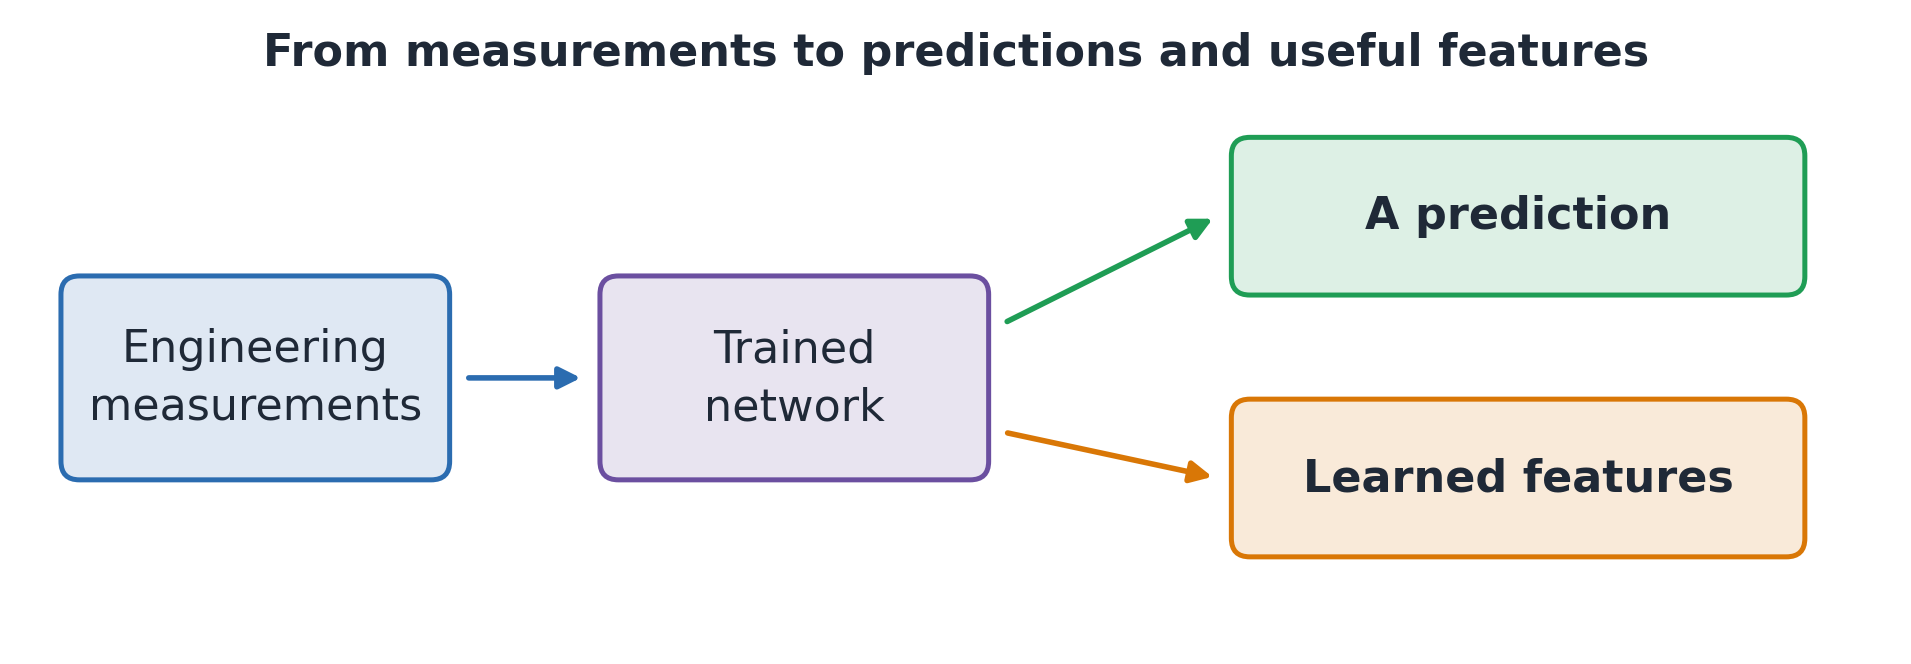
What can they predict? For example, concrete strength from its ingredients.
What can they learn from measurements? For example, useful features for detecting machine faults.
How can several sites learn together? For example, factories training a shared model while keeping their data locally.
FIG. From Measurements to Predictions and Features
Today’s Roadmap
Week 2 covered model evaluation. Today we focus on:
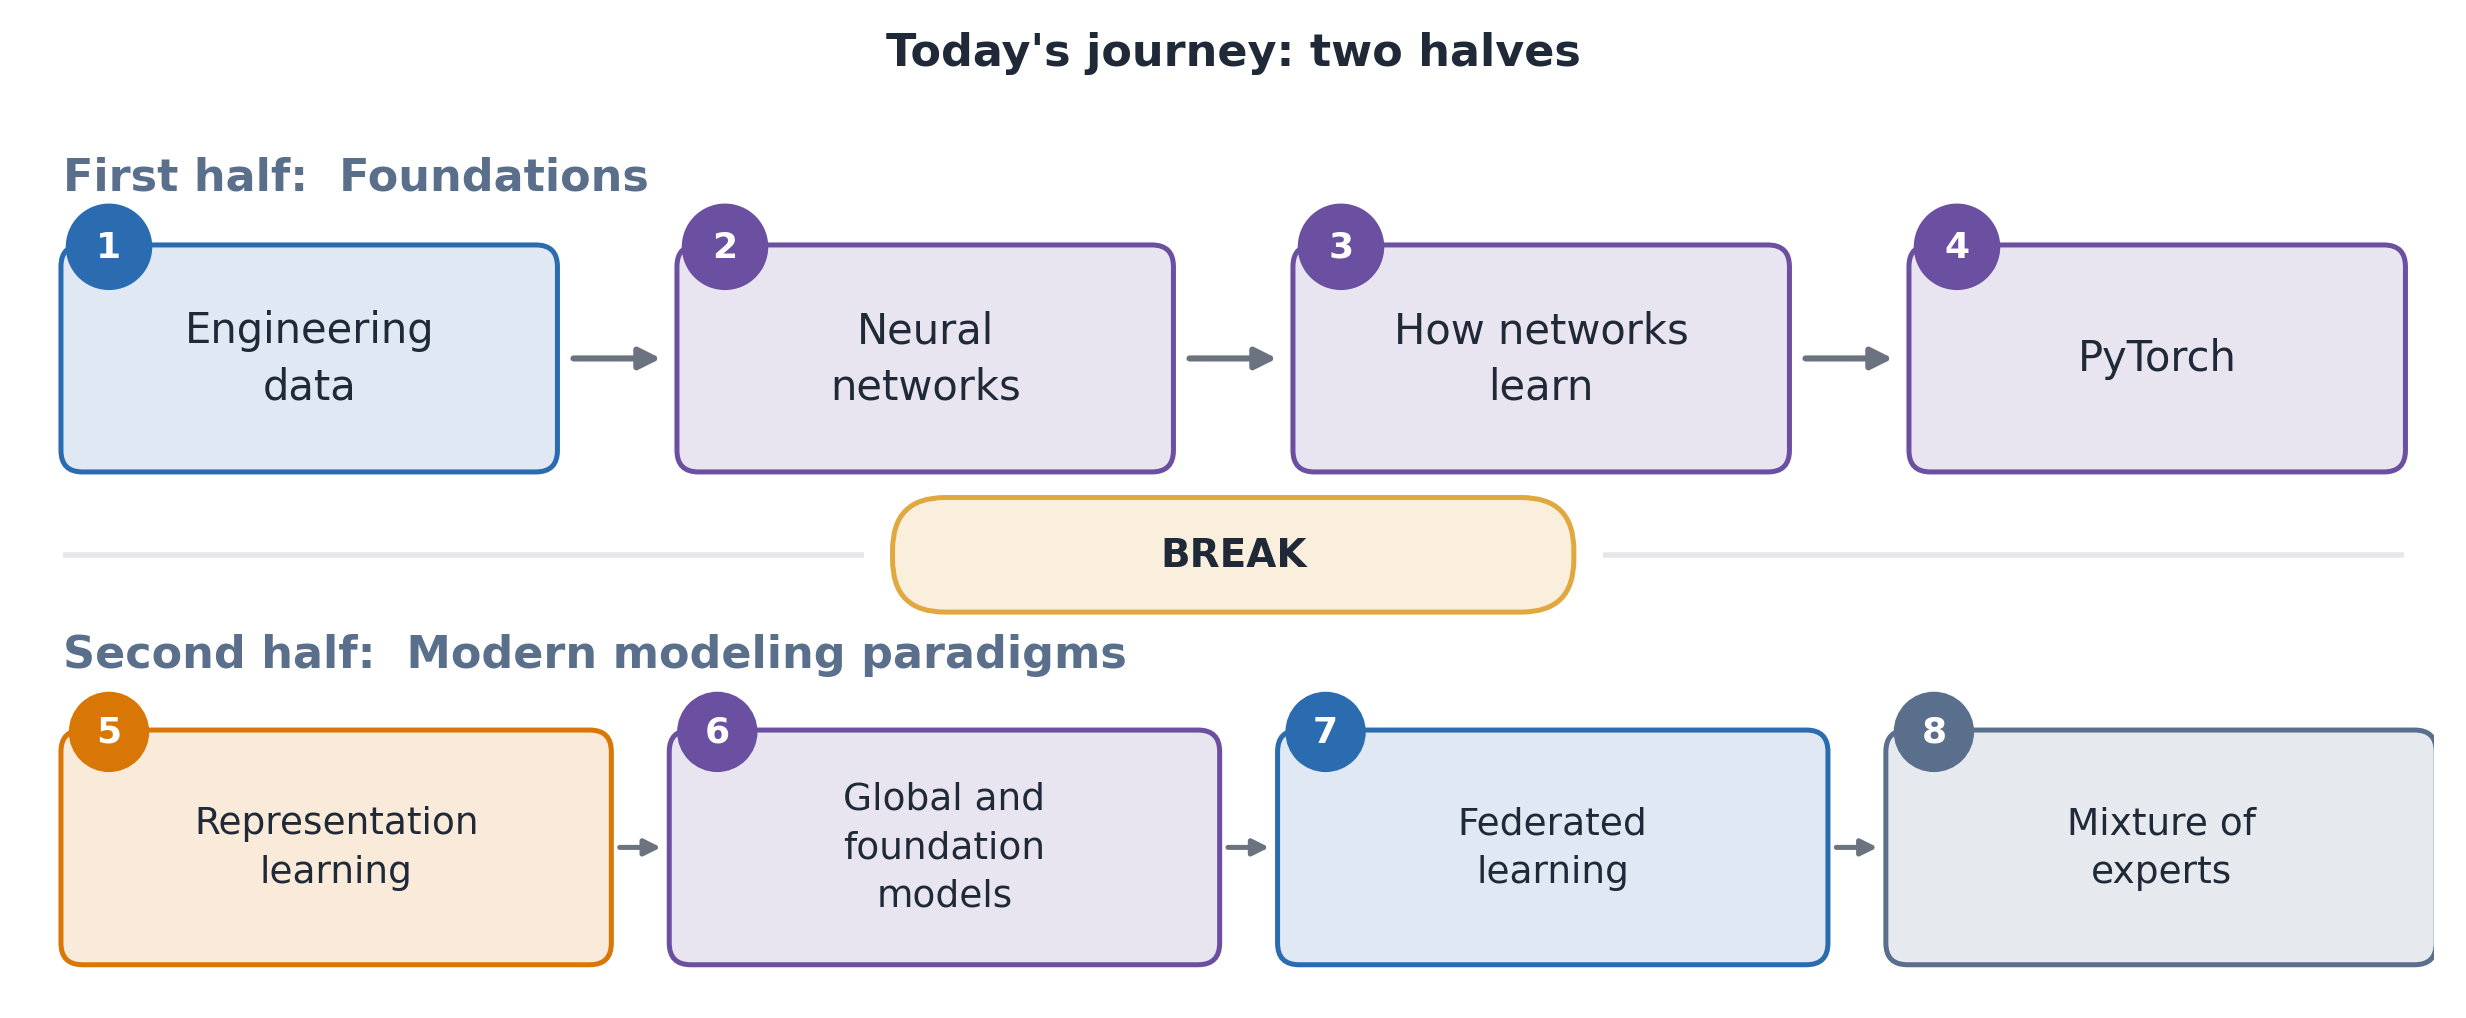
Neural-network foundations: how networks make predictions, learn, and are expressed in PyTorch.
Engineering applications: how the available data affect our modeling choices.
FIG. Lecture Topics Before and After the Break
Engineering Data: Inputs and Targets
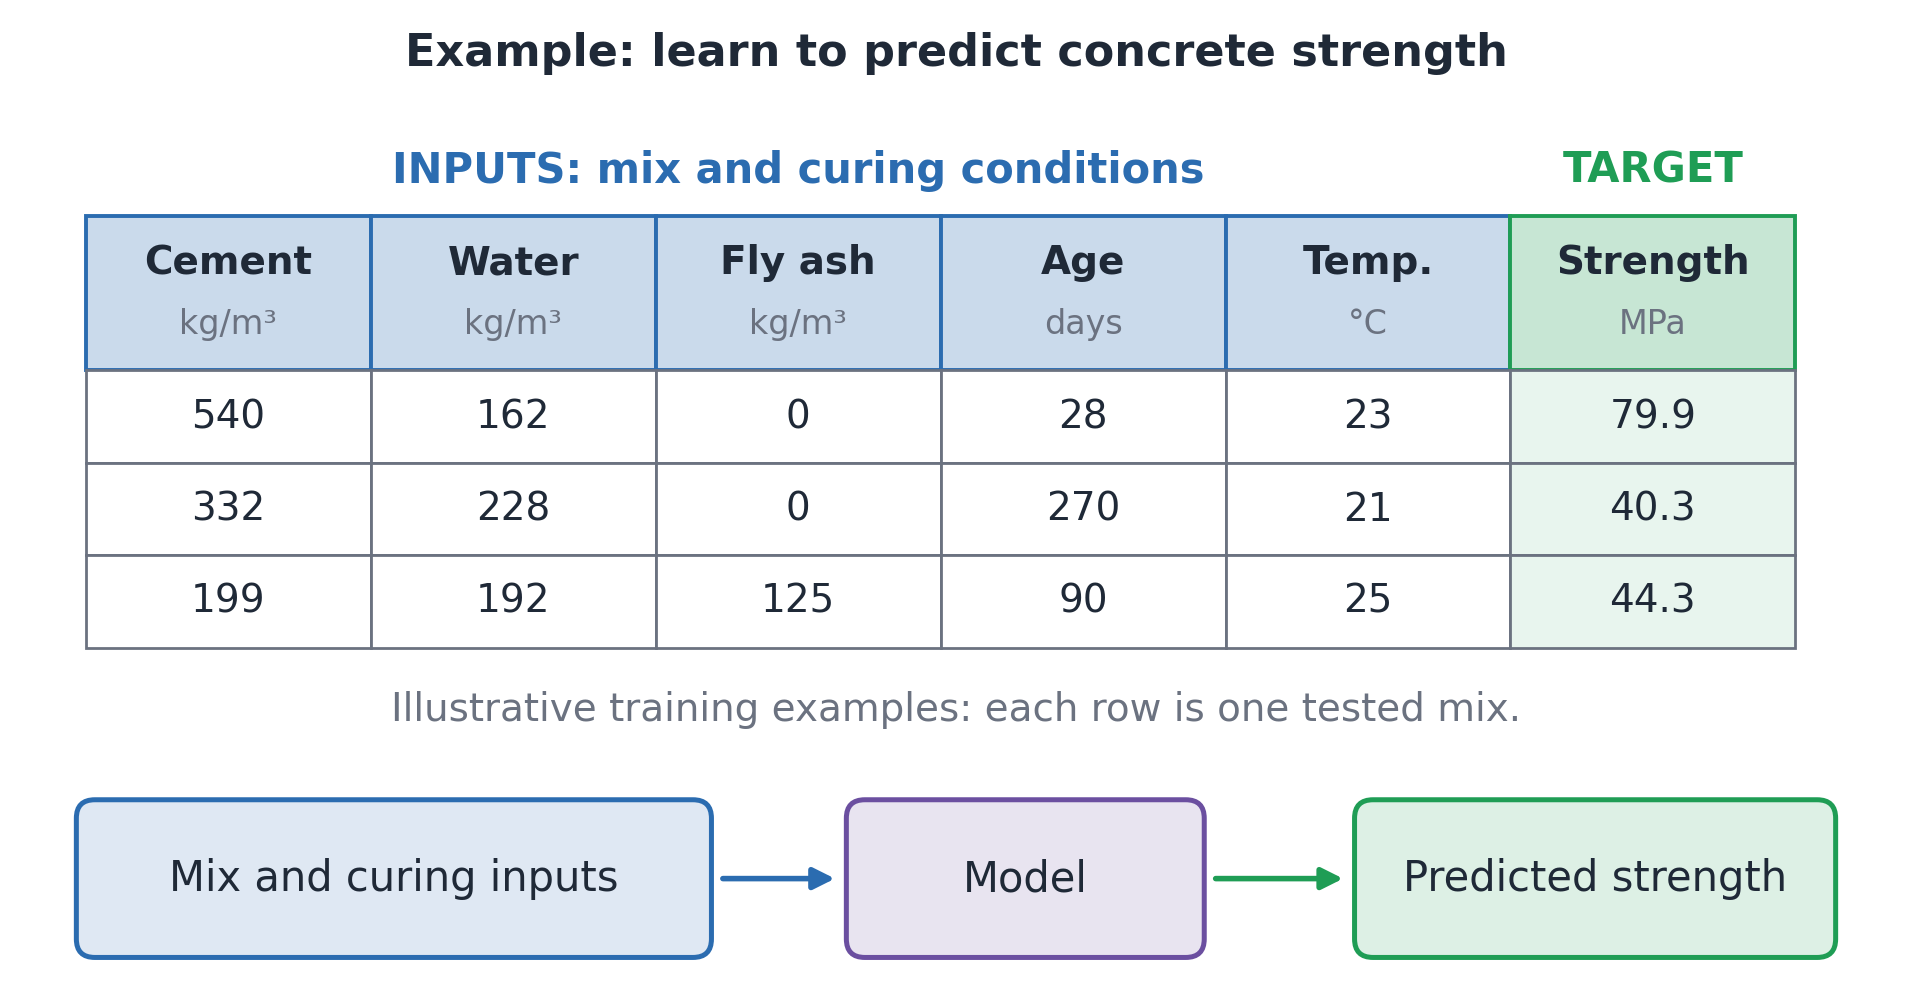
Tabular data are organized into rows and columns.
Each row is one example, such as a concrete mix tested in a laboratory.
The inputs describe that mix and its curing conditions.
The target is measured strength. Use only inputs available for a new mix.
TABLE. Concrete Inputs and Targets
FIG. Predicting Strength
Typical Engineering AI Problems
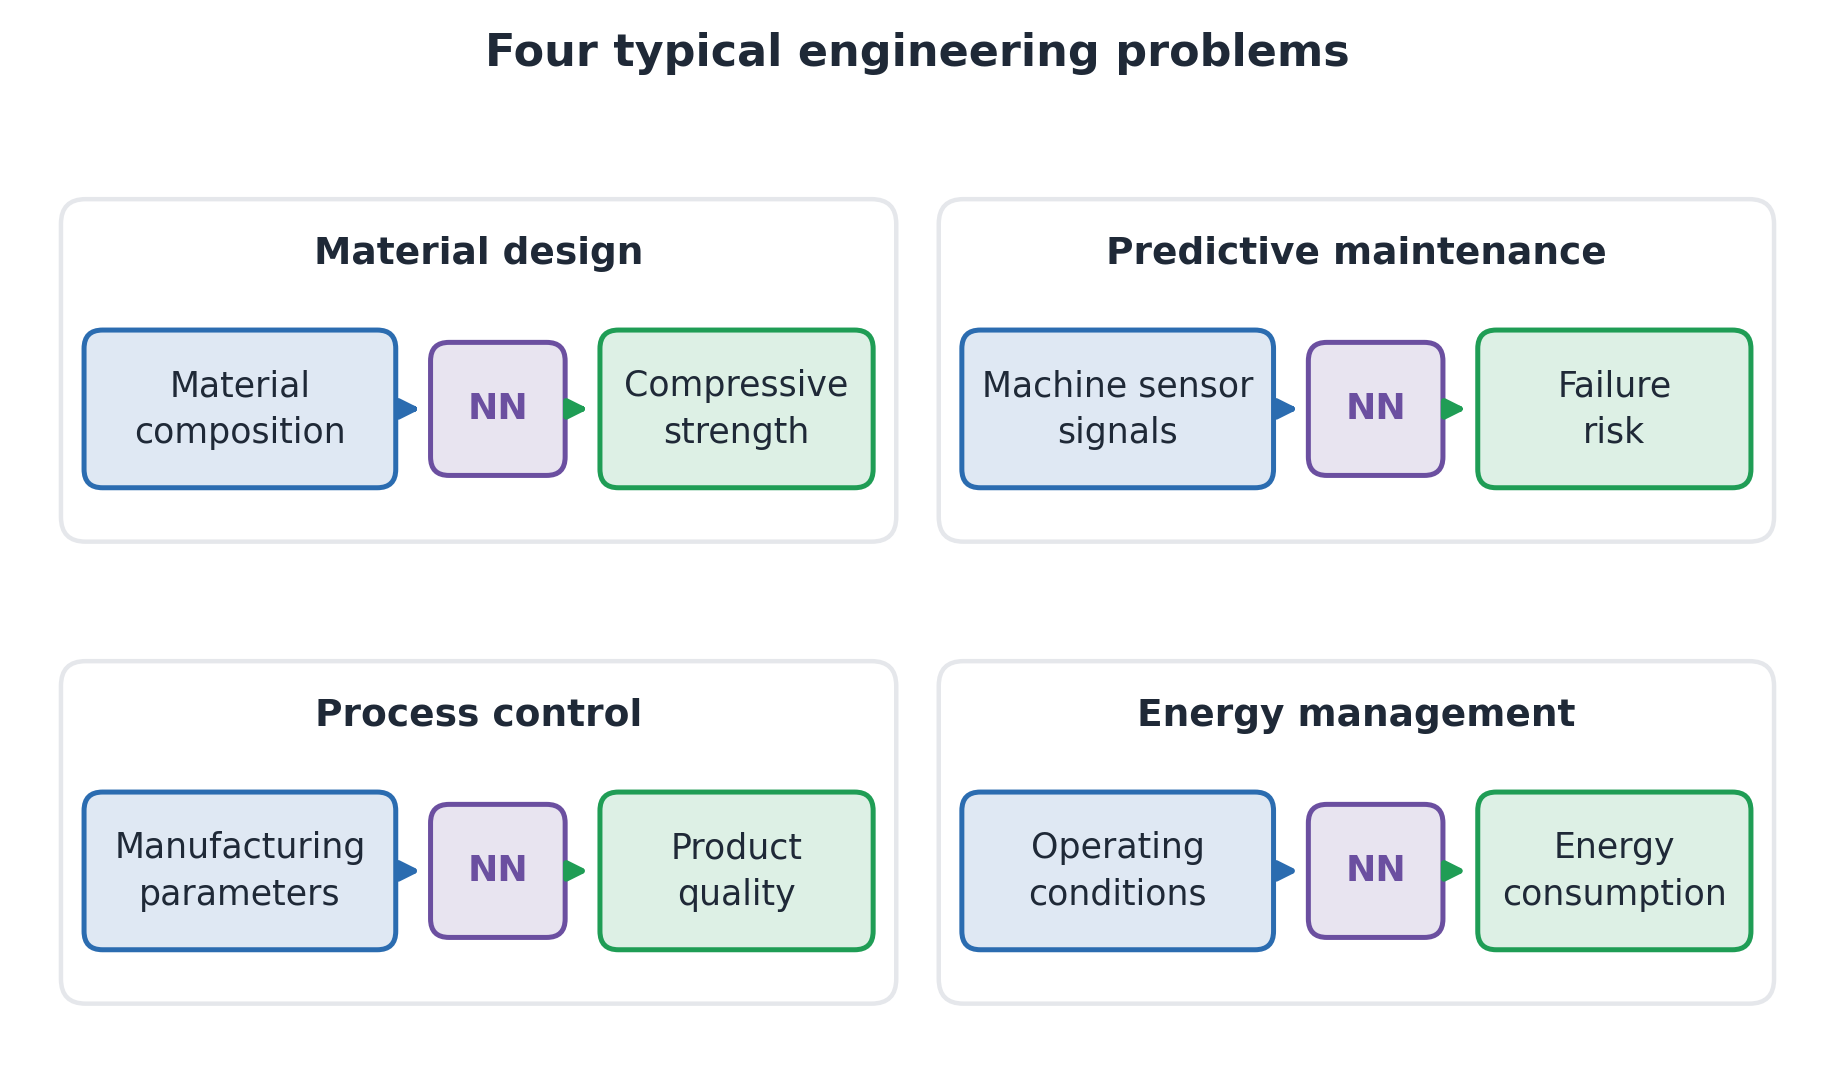
FIG. Engineering Inputs and Prediction Targets
In each example, a model uses measured inputs to estimate an outcome.
Start with a simple comparison model. On small tabular datasets, a random forest or gradient-boosted model may work as well as, or better than, a neural network.
Neural networks are useful when learning features from complex measurements or reusing learning across tasks.
Neural Networks
From Linear Model to Artificial Neuron
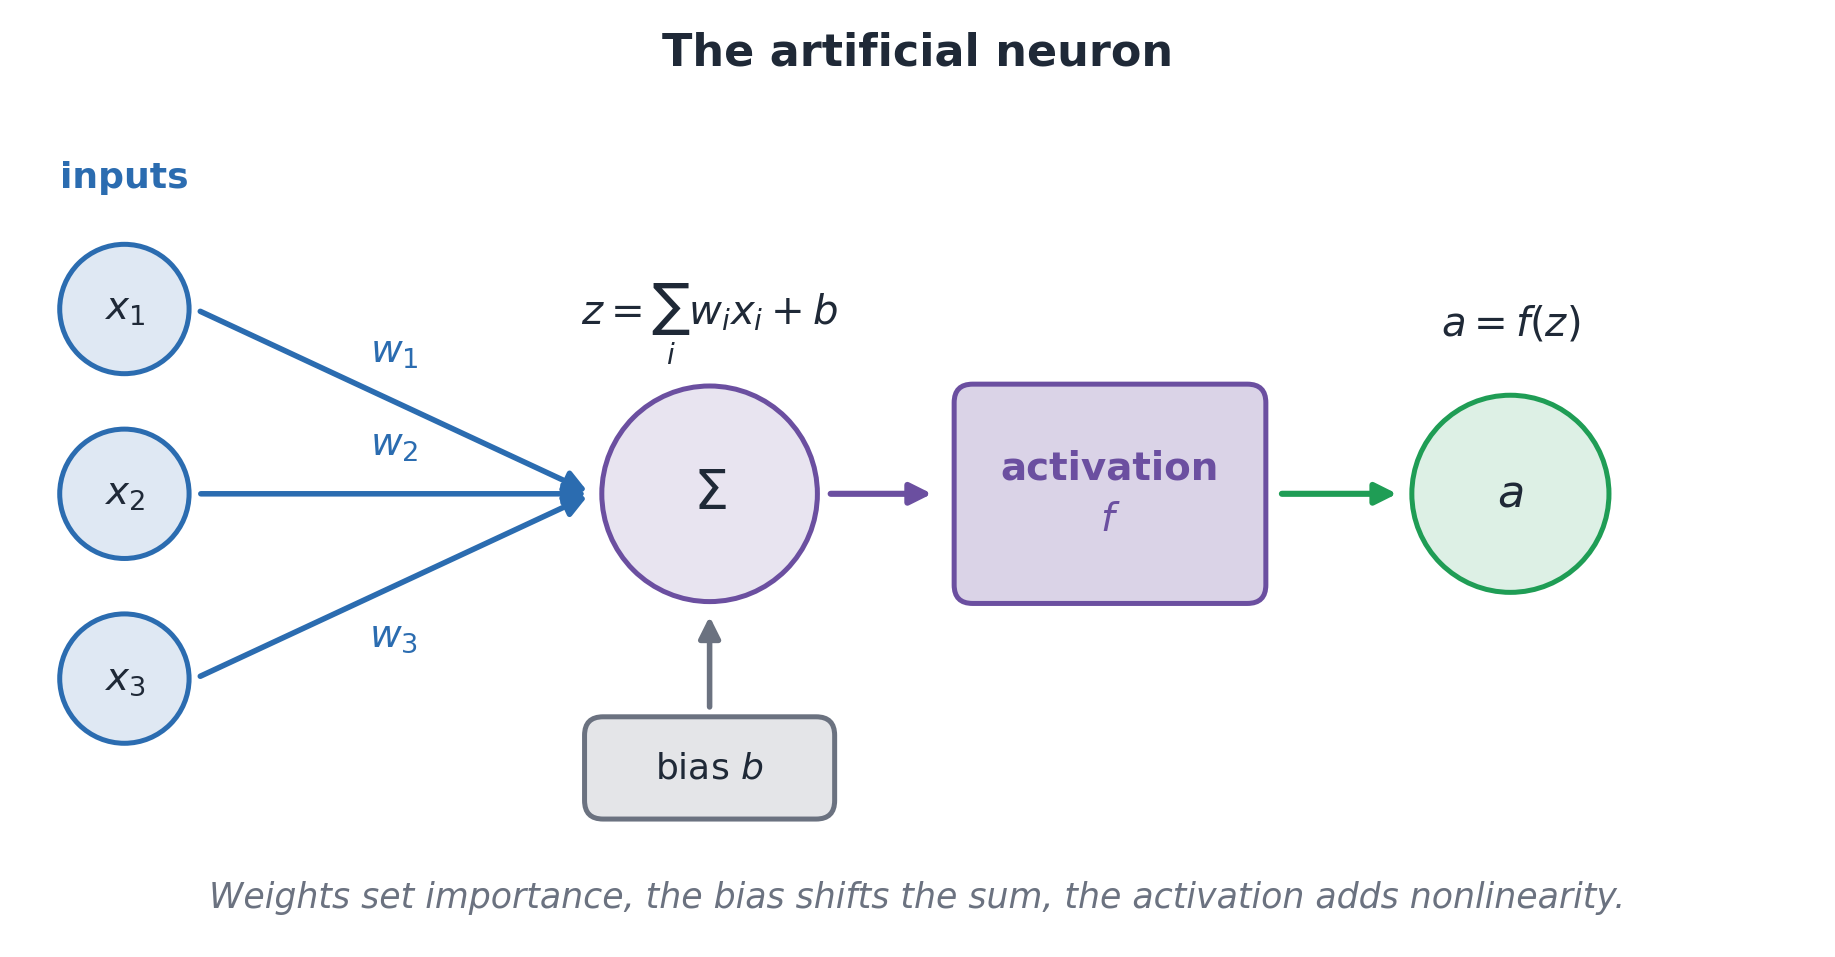
A neuron is a network’s basic building block: it combines inputs, then applies an activation. Training learns how to combine the inputs.
x_i: input i; w_i: its learned weight; b: a learned bias.
z: the weighted sum; f: activation function; a: neuron output.
FIG. Weighted Inputs, Bias, Activation, and Neuron Output
What Do Hidden Layers Learn?
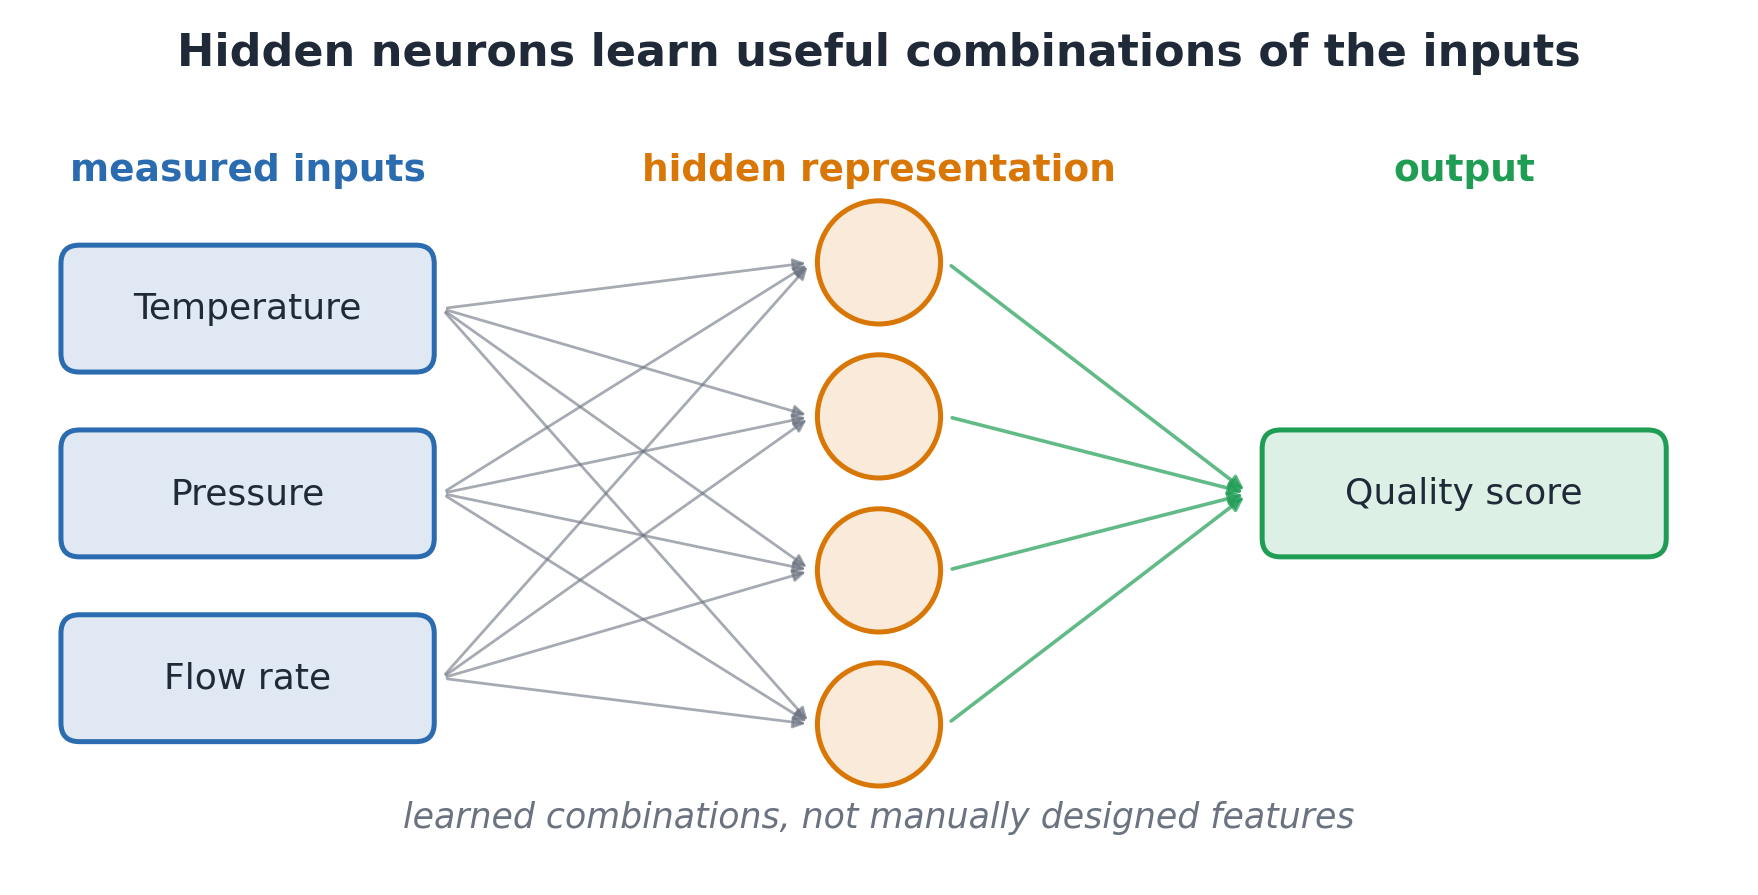
A hidden layer sits between the inputs and the final prediction.
Its units learn combinations of measurements that help the prediction task. For example, a useful combination might involve temperature, pressure, and flow.
FIG. Inputs, Learned Hidden Features, and Prediction
These features form a representation. They help the final layer predict from patterns across measurements. They need not correspond to named physical quantities.
From a Neuron to a Network
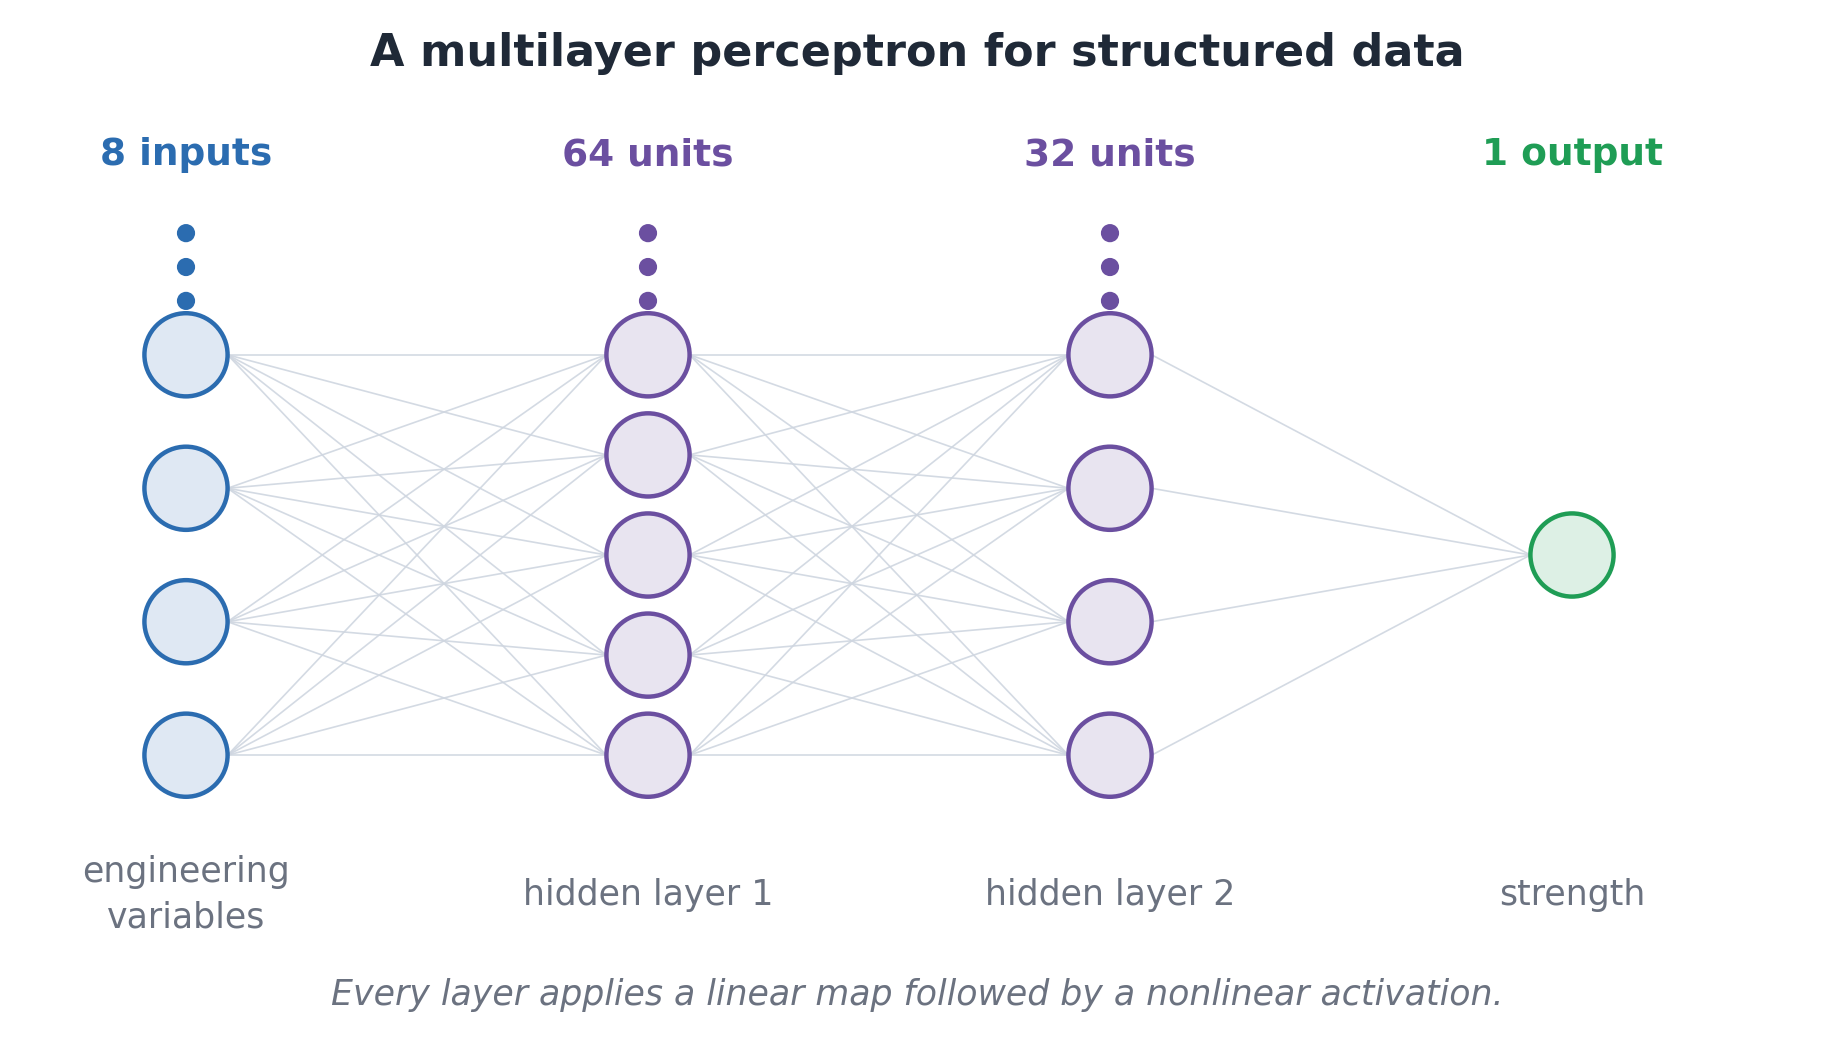
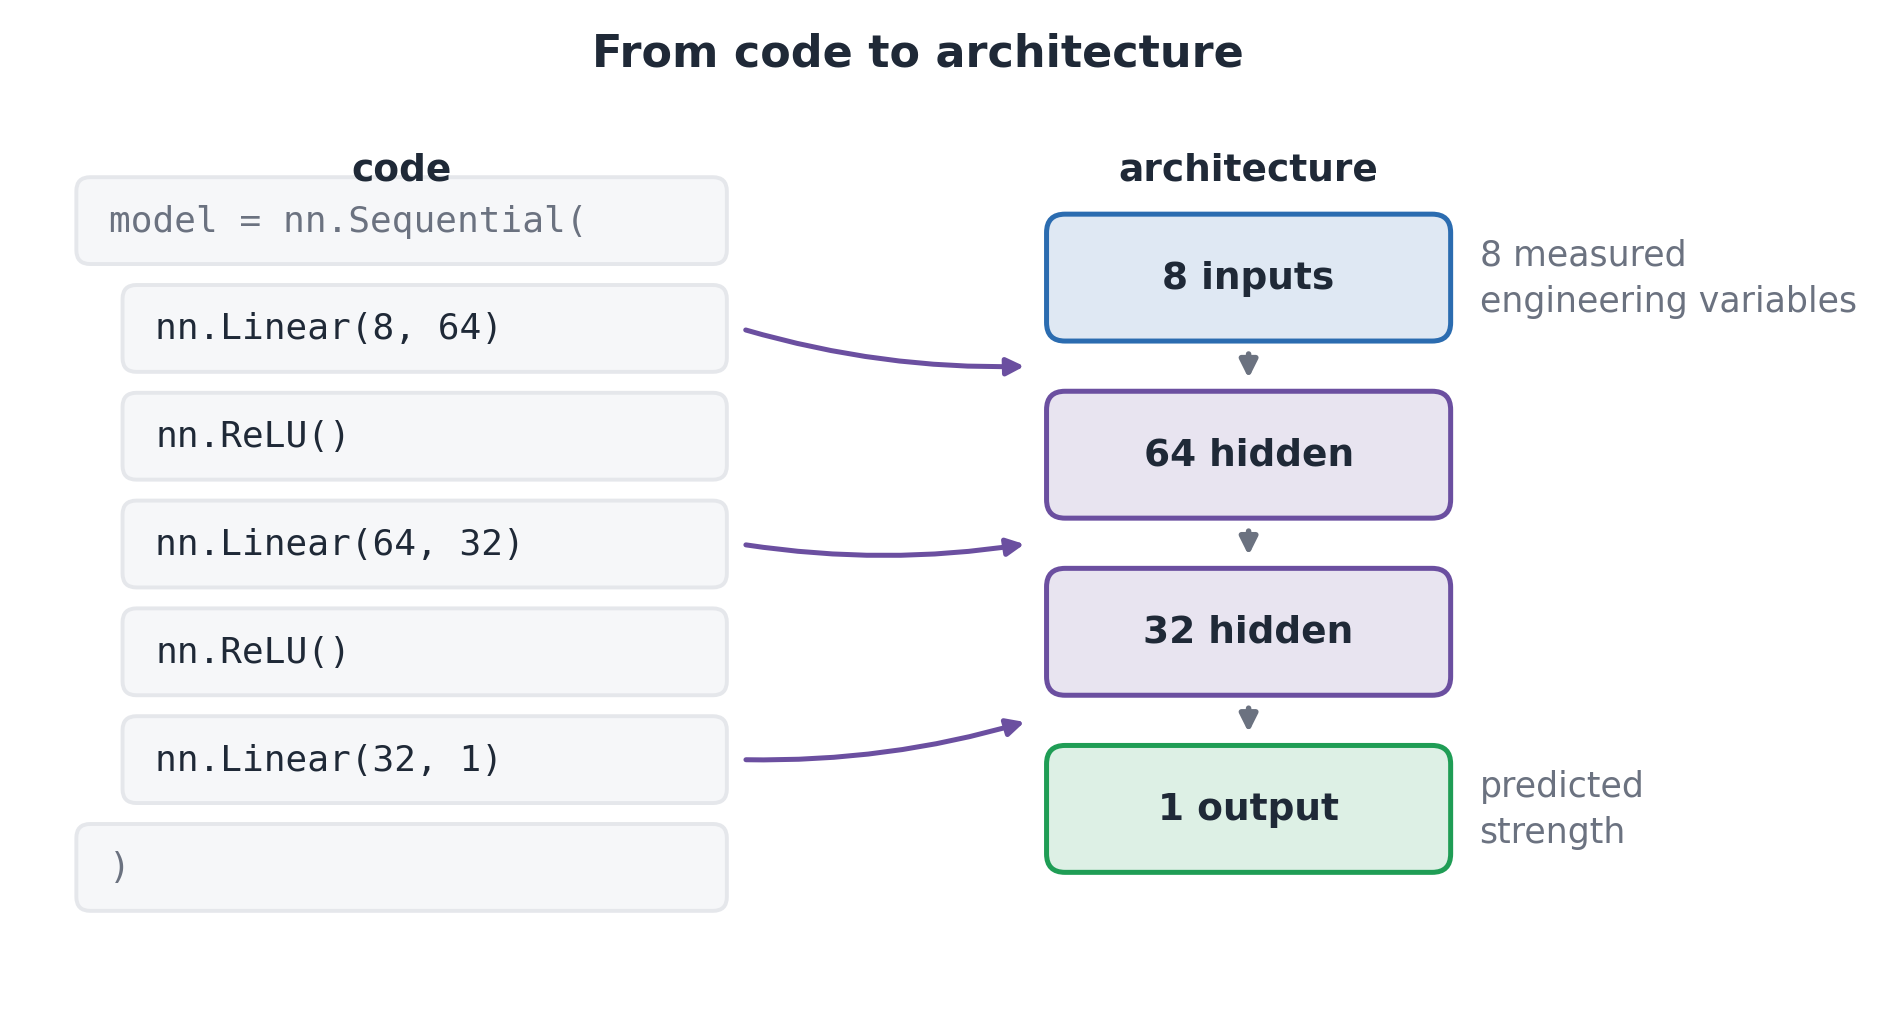
A multilayer perceptron (MLP) is a network of fully connected layers: each unit receives the outputs of the previous layer.
FIG. An Eight-Input Multilayer Perceptron
One layer computes h=f(Wx+b): W contains its weights, b its biases, and h its outputs.
Layers turn measurements into learned features, then a prediction. For example: 8 inputs → 64 units → 32 units → 1 strength prediction.
Why Activation Functions?
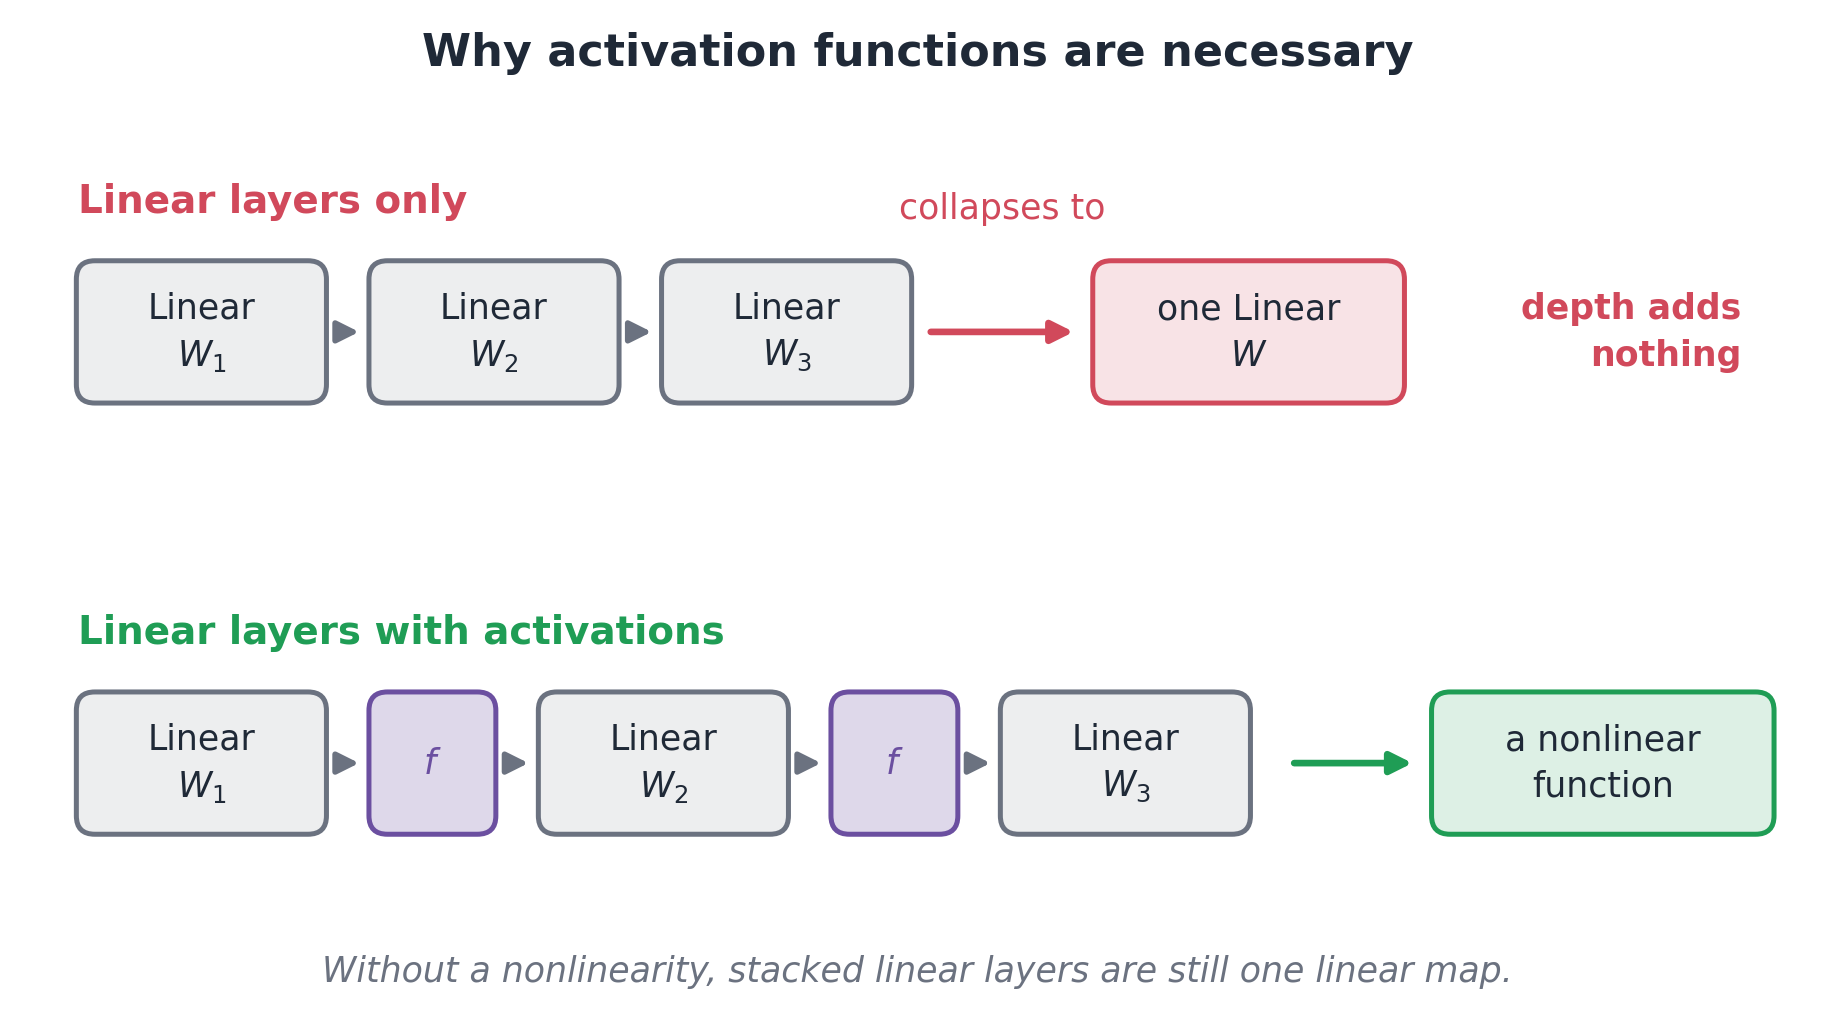
Nonlinear activations let a network learn curved and more complex relationships.
Without them, several linear layers are equivalent to one linear layer:
FIG. Why Stacked Linear Layers Need Nonlinear Activations
Common choices: ReLU for hidden layers; sigmoid for a binary probability; softmax for probabilities across classes. A numerical output often uses no final activation.
A Network Maps Inputs to Predictions
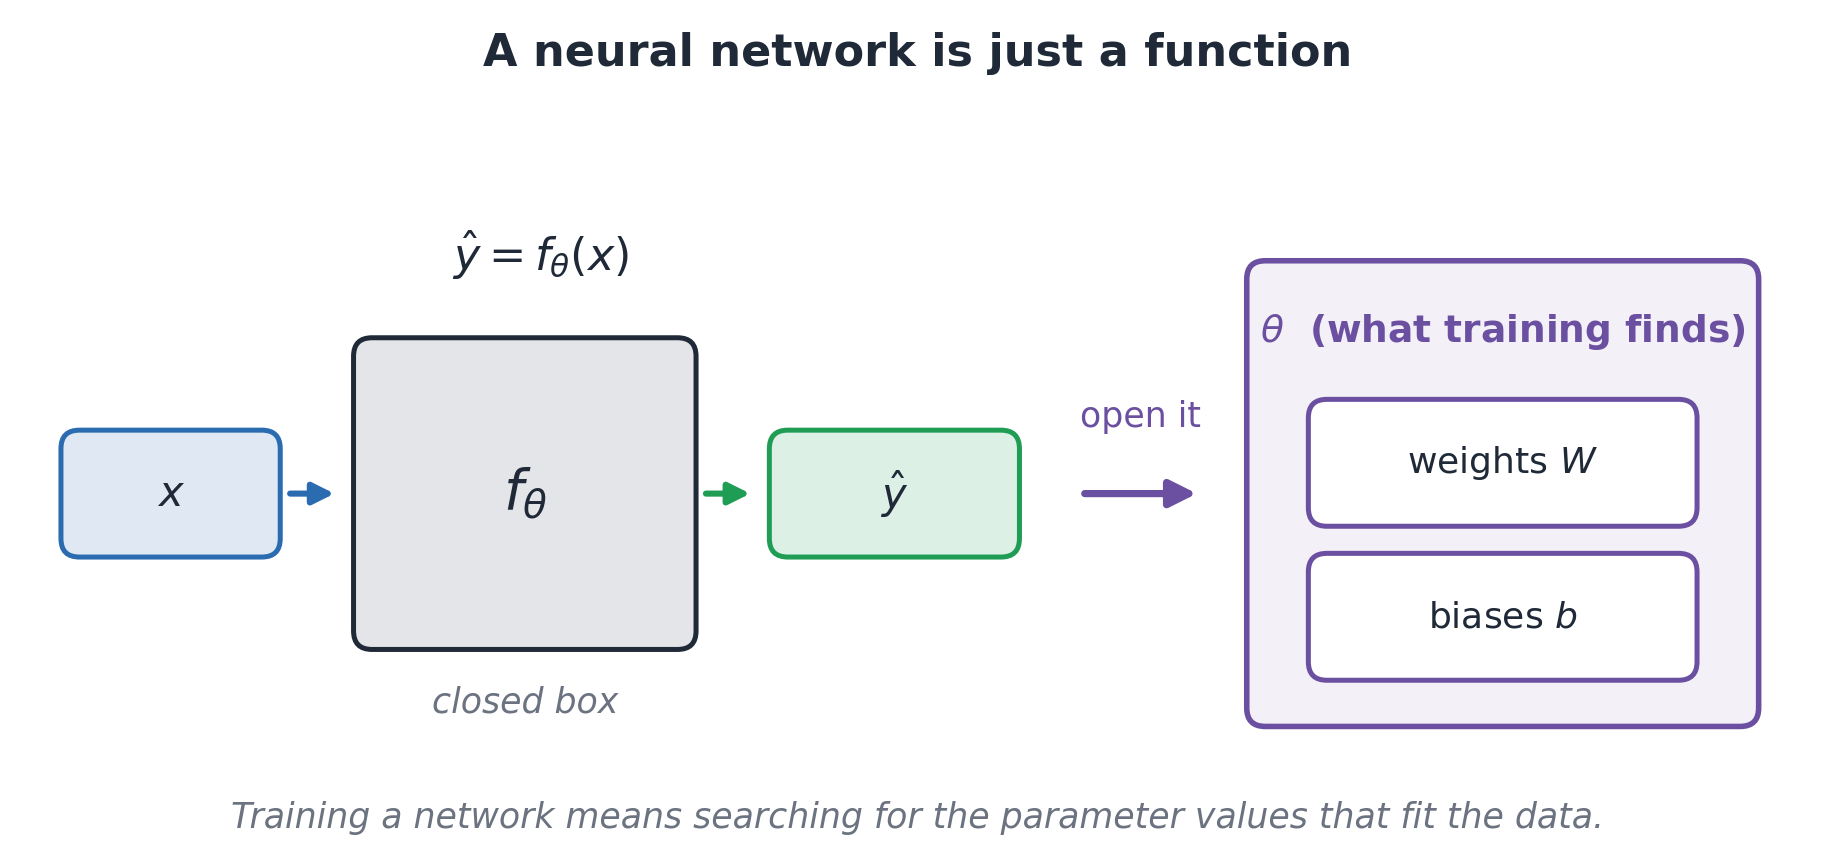
We can write a network’s prediction as \hat{y}=f_\theta(x).
x: the measured inputs.
\theta: all the weights and biases that training can change.
\hat{y}: the predicted output.
FIG. The Network Function and Its Learned Parameters
Training adjusts parameters to reduce prediction errors.
Part II. How Does the Network Learn?
Make a prediction, measure its error, and update the parameters.
The Forward Pass and the Loss
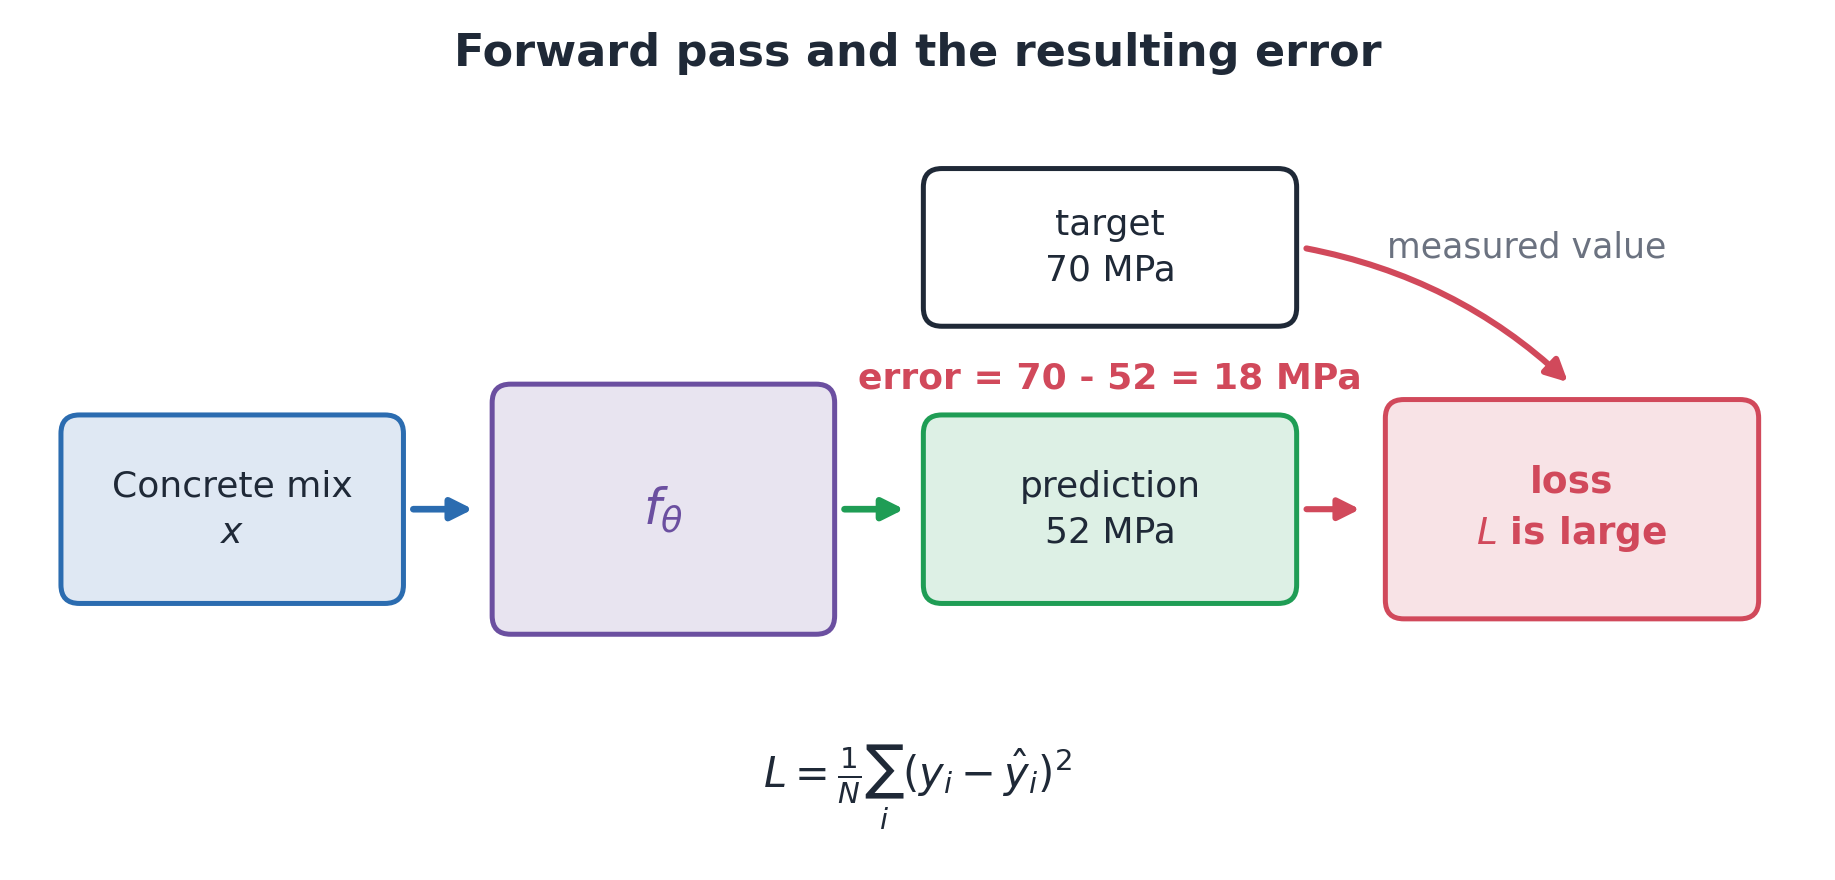
The forward pass computes a prediction. The loss gives training an objective: reduce prediction error.
For N examples, mean squared error compares targets y_i with predictions \hat y_i:
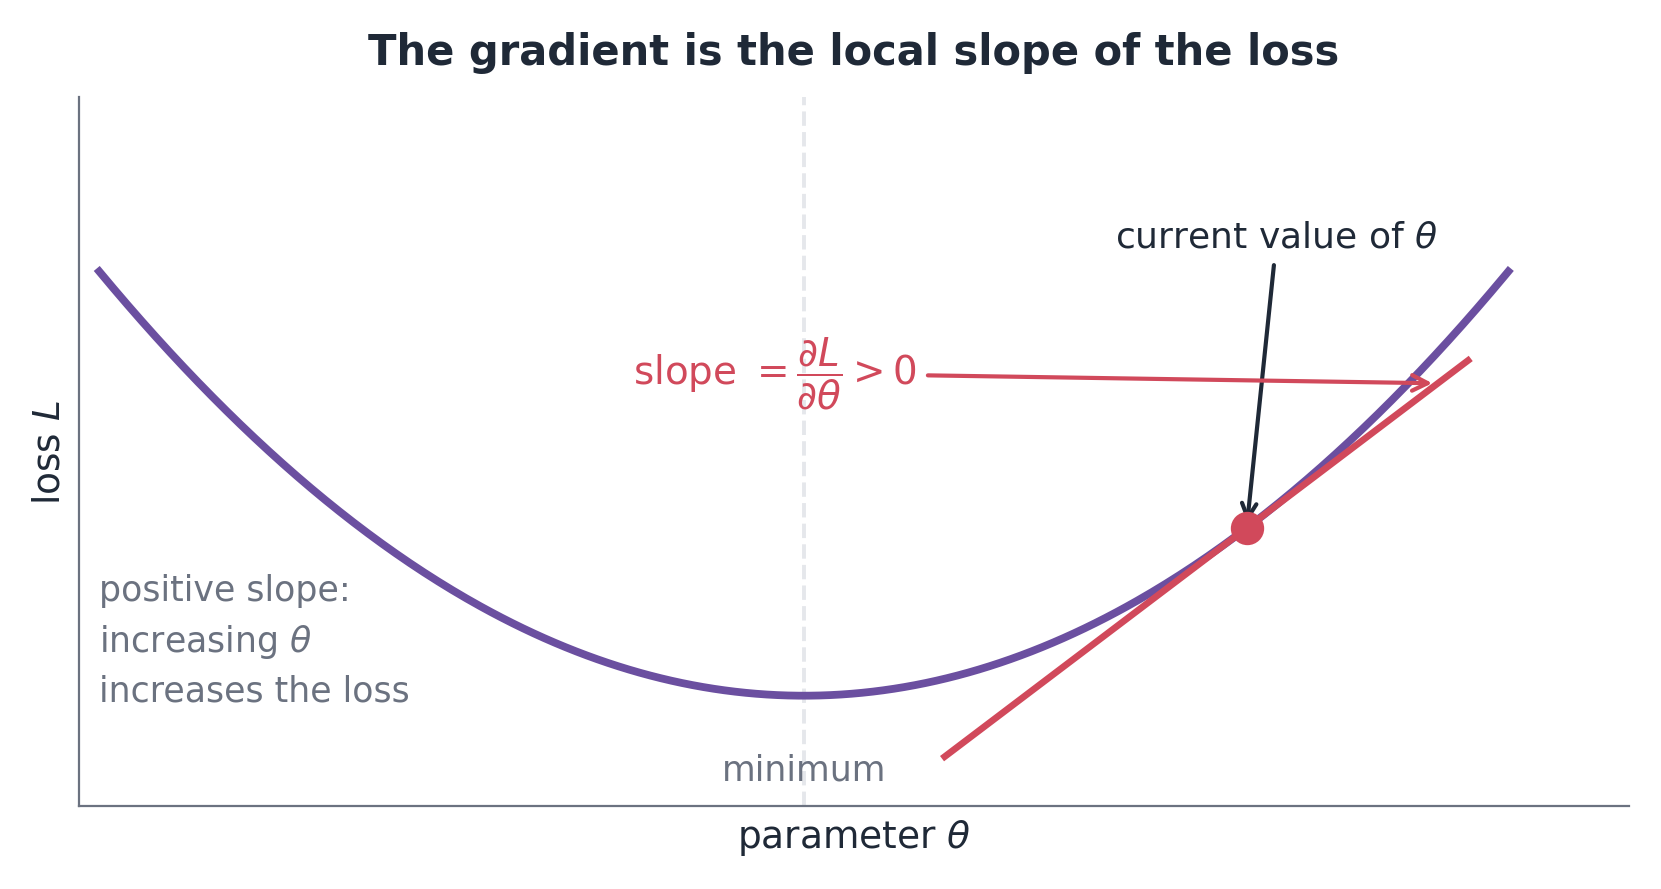
A gradient describes how the loss changes when each parameter changes slightly.
FIG. How Loss Changes with a Model Parameter
Use the gradient to choose an update that aims to lower the loss:
\theta \leftarrow \theta-\eta\nabla_\theta L
\nabla_\theta L is the gradient of the loss. The learning rate\eta controls the update size.
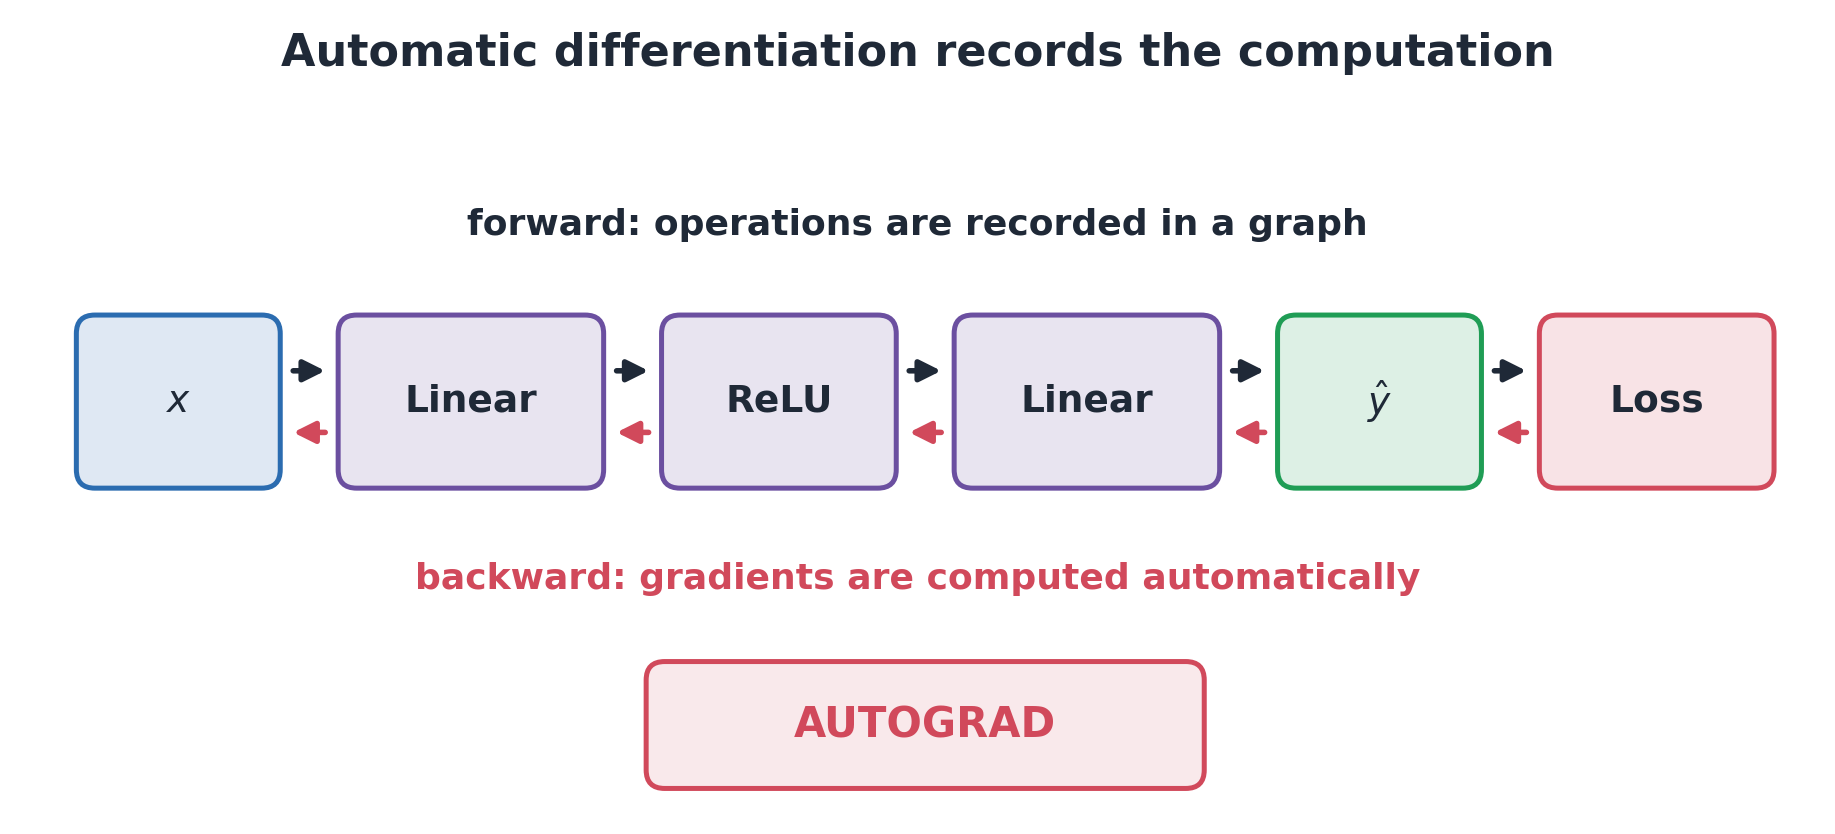
Backpropagation
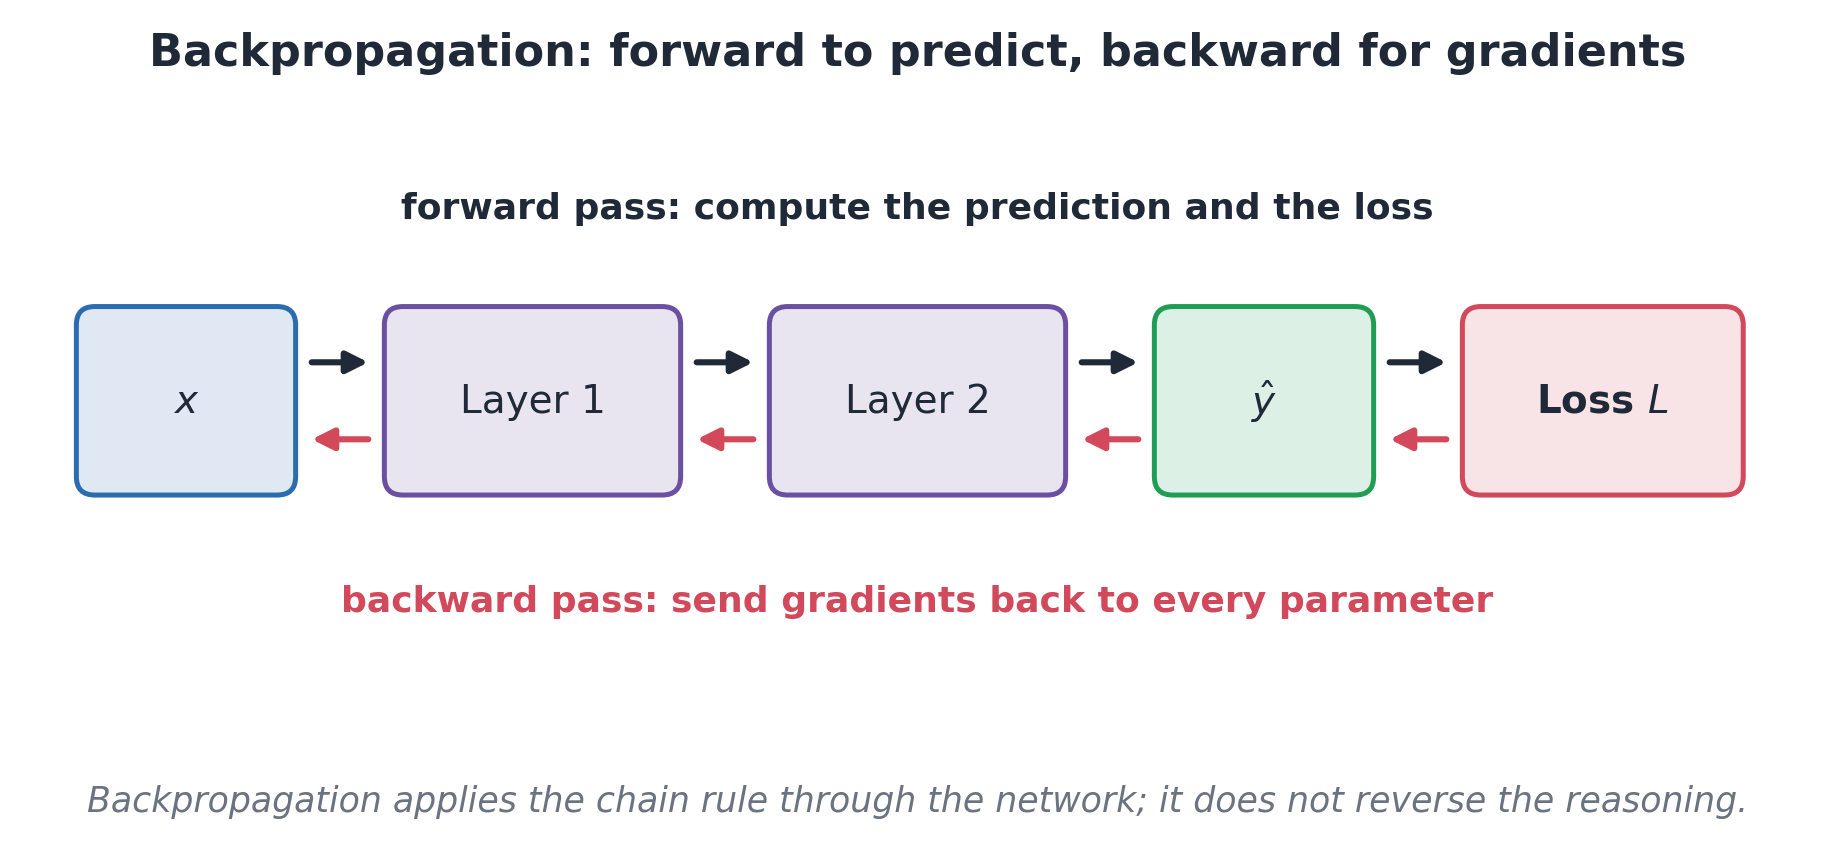
FIG. Forward Predictions and Backward Gradients
Backpropagation computes the gradients needed for training. It works backward from the loss through the network’s calculations.
The optimizer then uses those gradients to update the parameters.
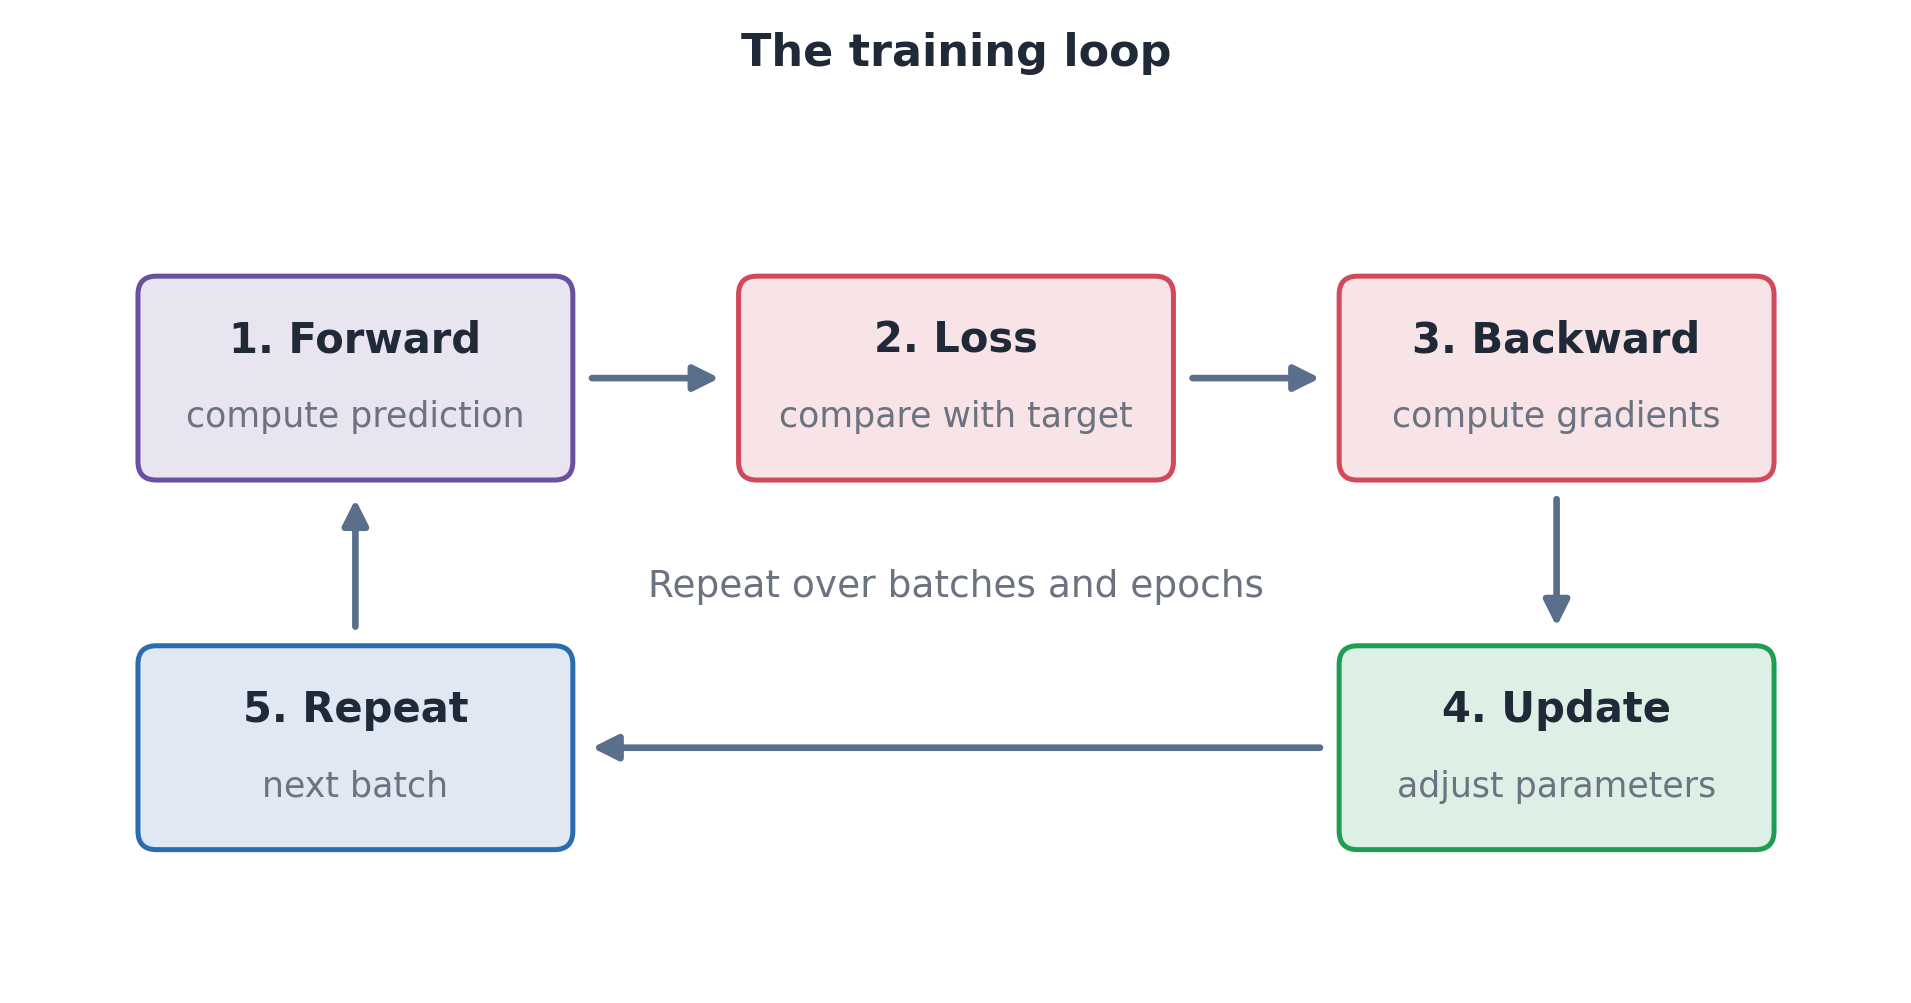
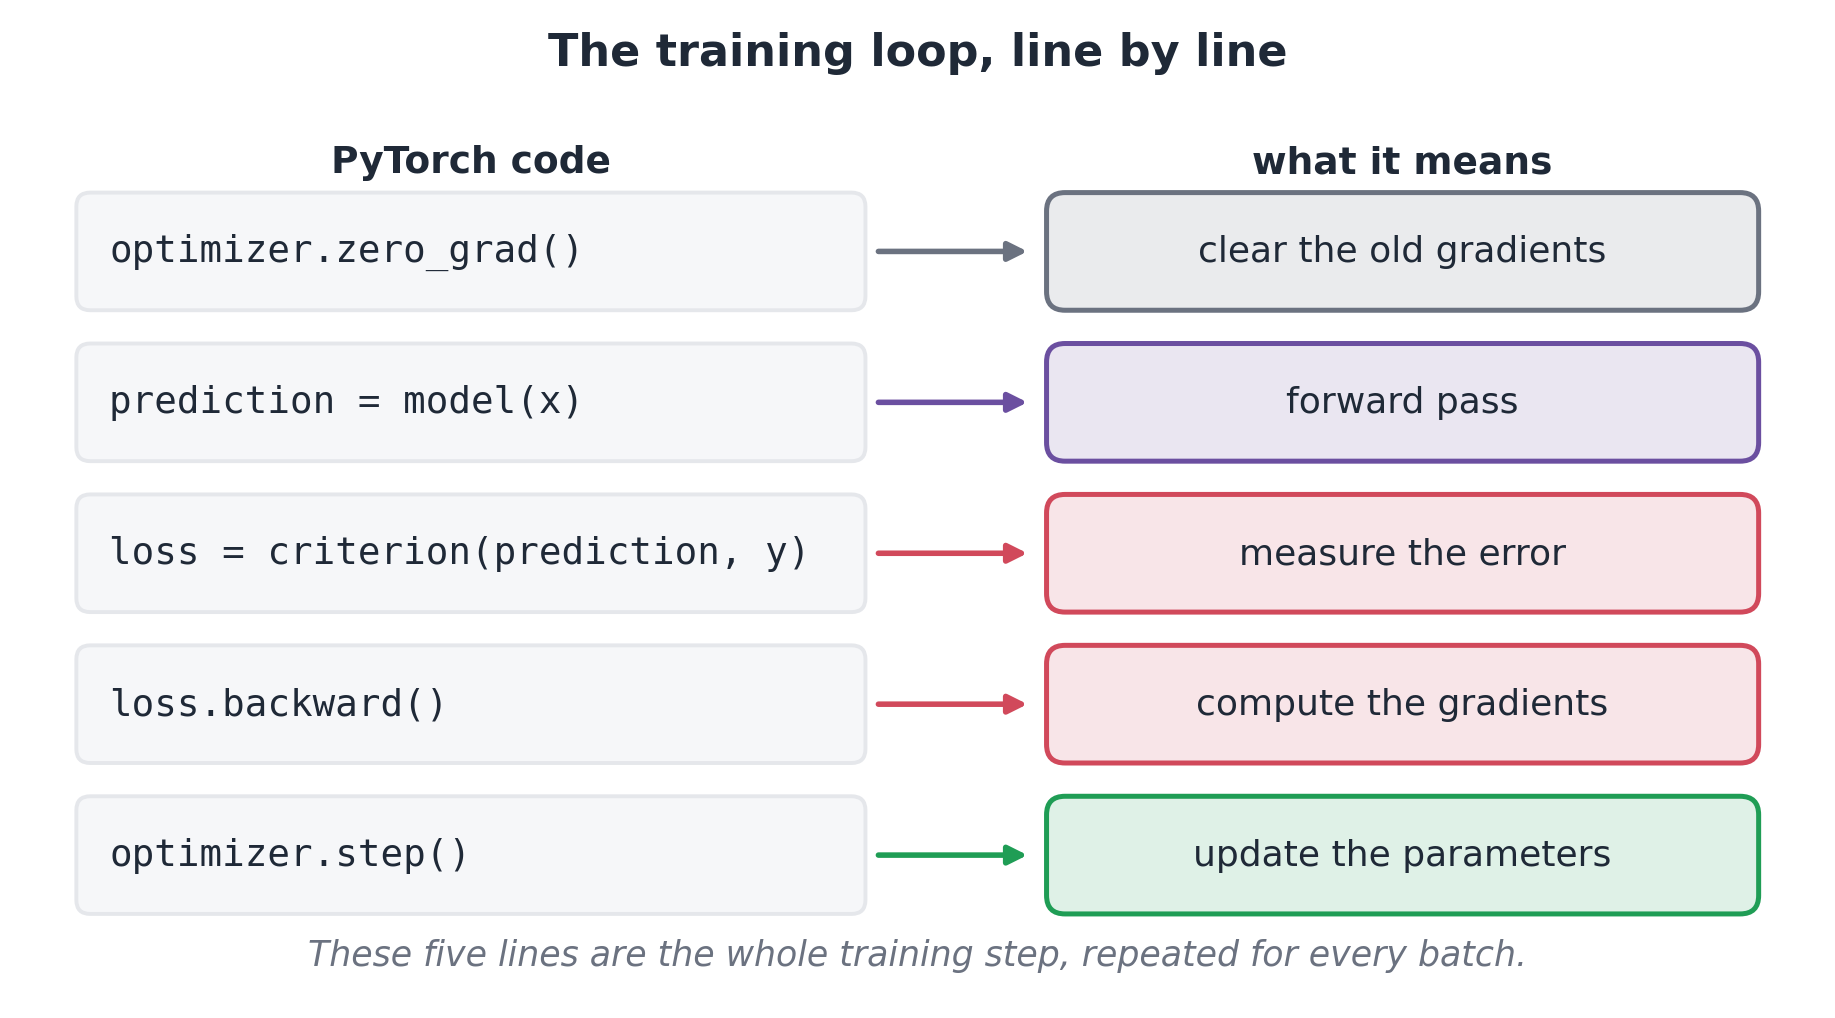
The Complete Training Loop
FIG. Prediction, Loss, Gradients, and Parameter Updates
Make predictions and calculate the loss.
Compute gradients and update the parameters.
Repeat with more training examples.
Each update aims to improve the model’s predictions.
Batches, Learning Rate, and Optimizer
A batch is a group of examples used for one update. An epoch is one pass through the training set.
With 1,000 examples and batches of 100, one epoch has 10 updates.
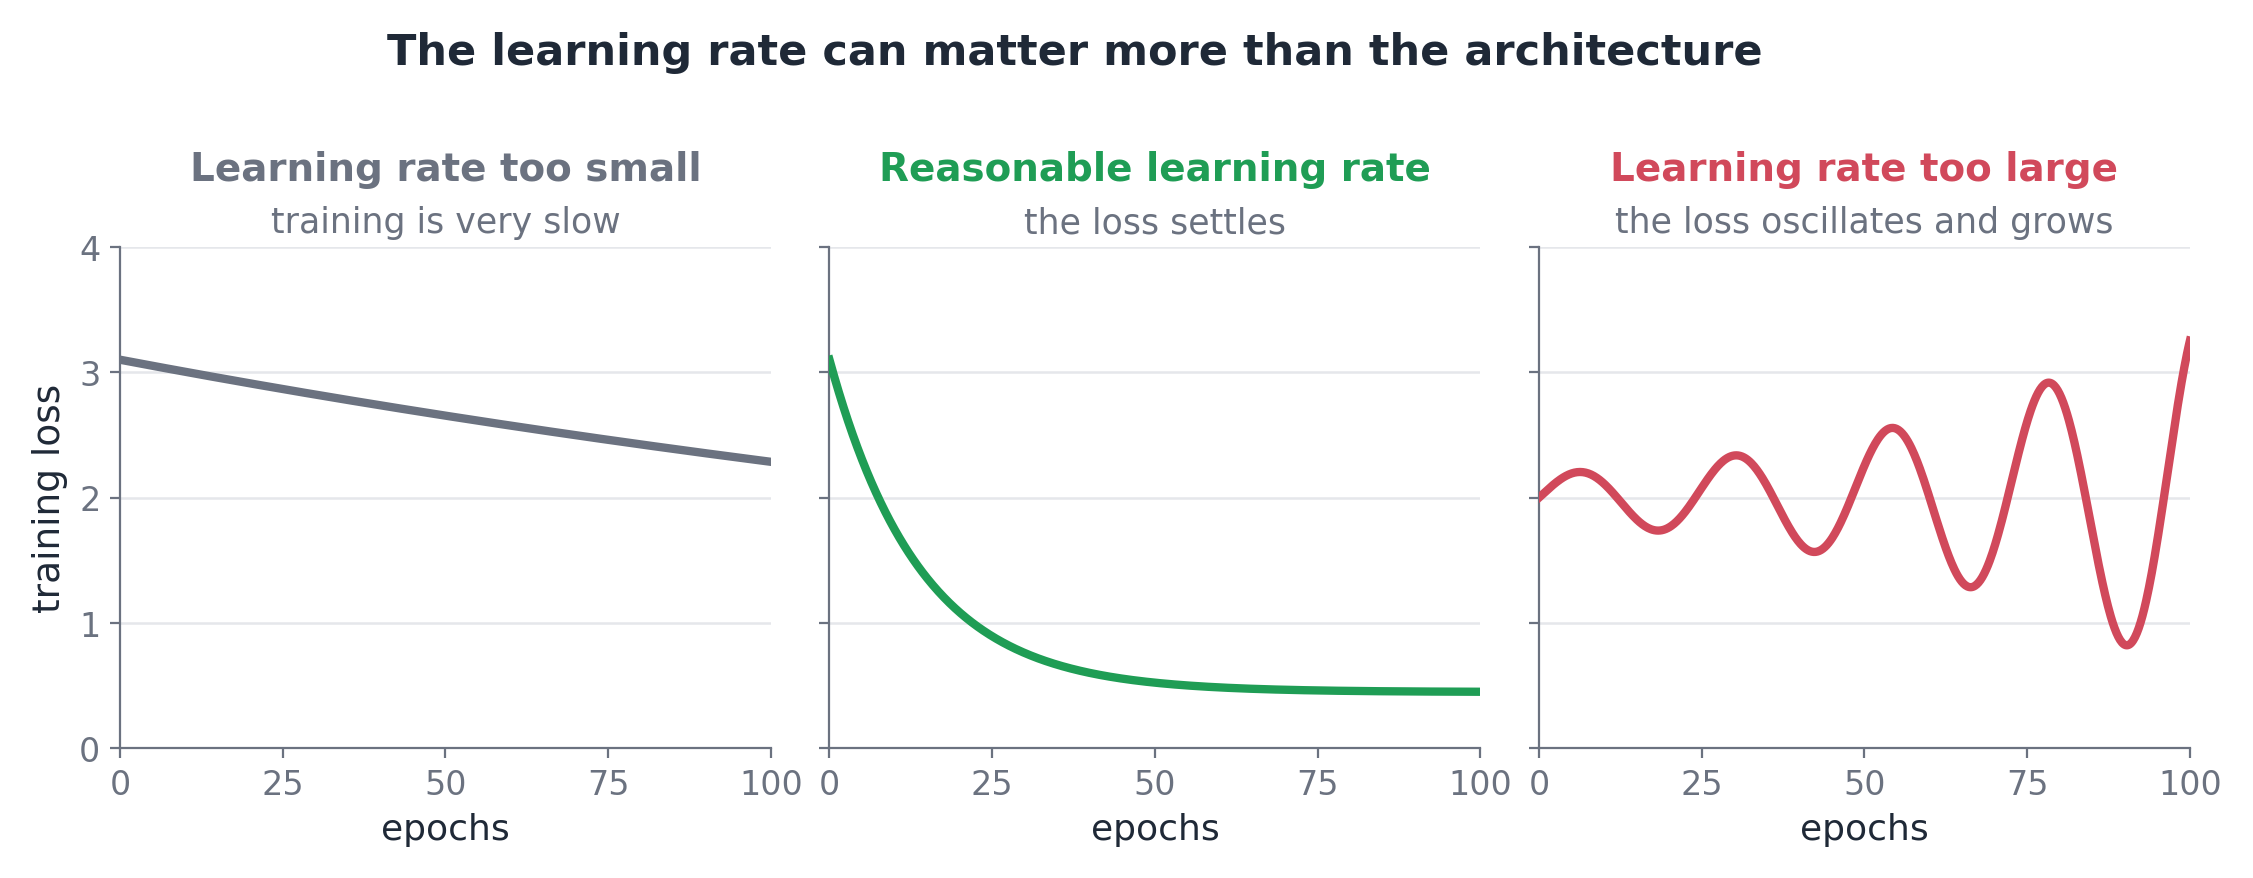
FIG. How Learning Rate Affects Training Loss
The optimizer (for example, SGD or Adam) determines the update. The learning rate sets its size: too small can be slow; too large can be unstable.
Training, Validation, and Test
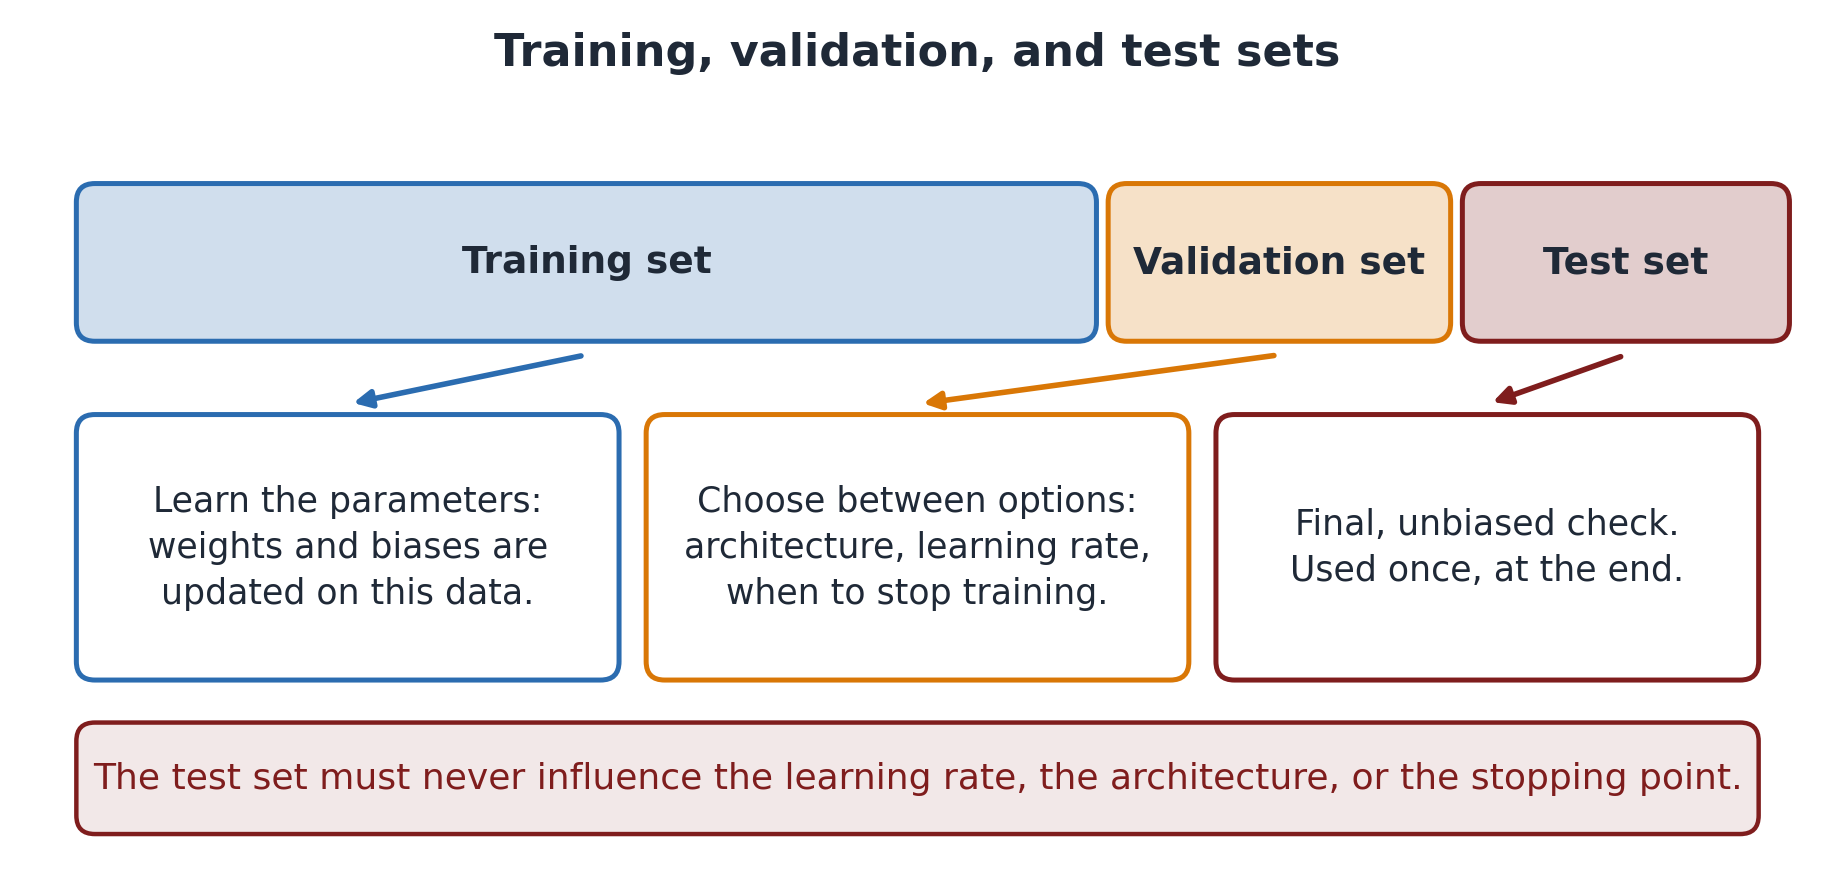
FIG. Roles of Training, Validation, and Test Data
Training data: used to adjust the model’s parameters.
Validation data: used to choose settings and decide when to stop.
Test data: kept separate for the final assessment.
Do not use test results to tune the model.
Overfitting in Neural Networks
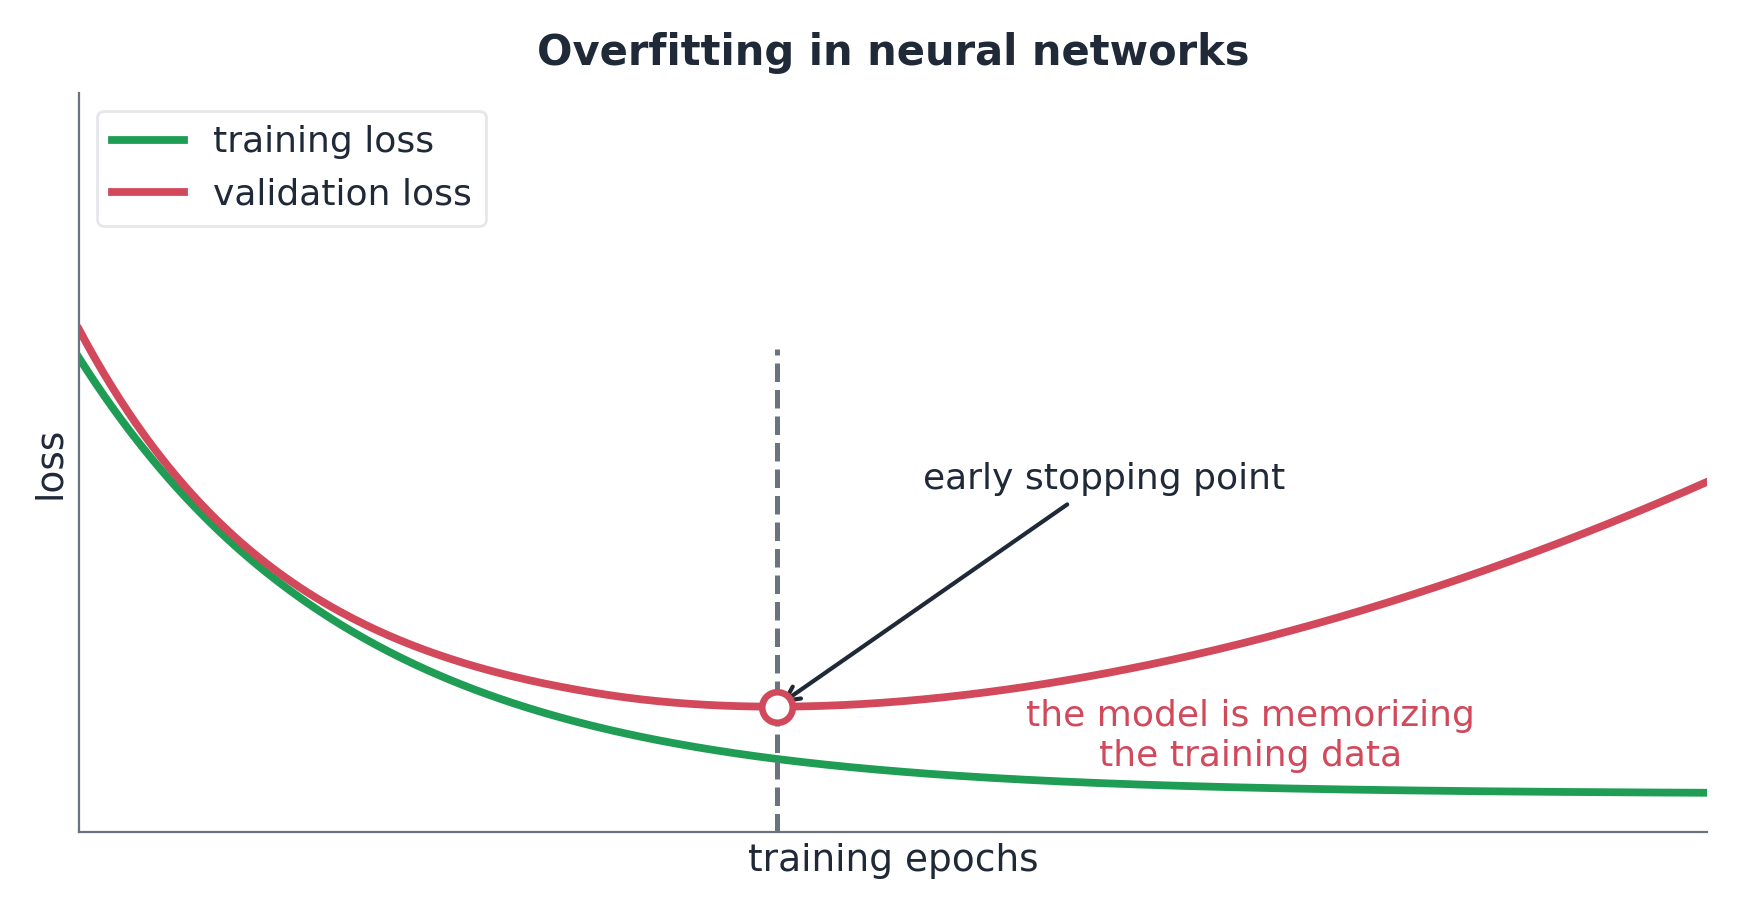
FIG. Training and Validation Loss During Overfitting
Overfitting occurs when a model fits the training examples but performs poorly on new examples.
If training loss falls while validation loss rises, consider more representative data, a simpler model, or regularization. Early stopping keeps a model from an earlier, better validation result.
PyTorch
Connecting the training concepts to code.
What Is PyTorch?
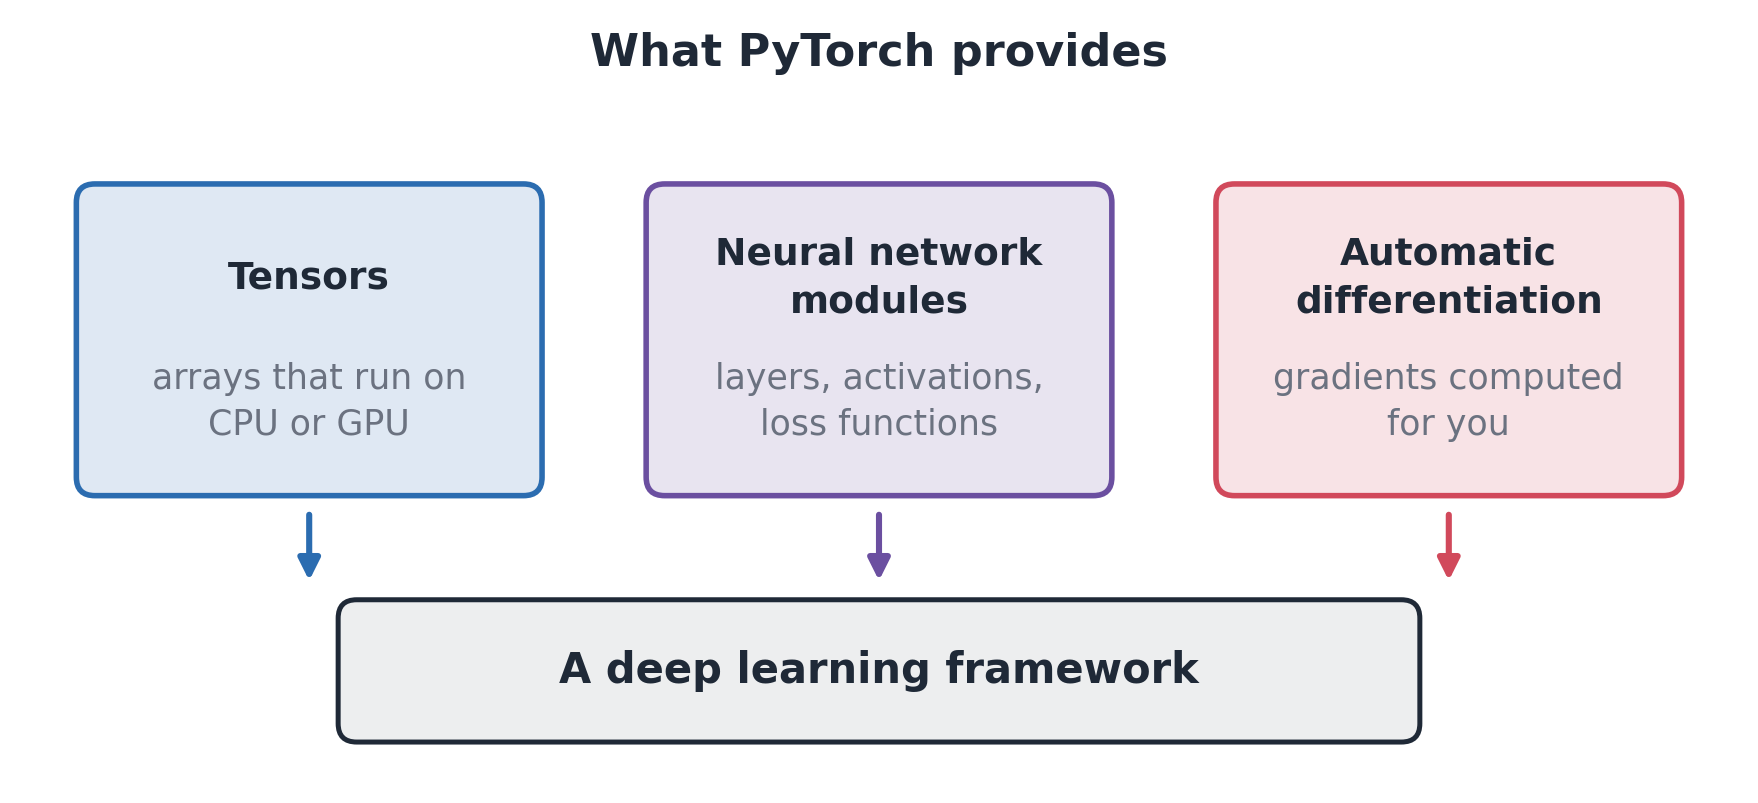
PyTorch is a Python library for building and training neural networks.
FIG. PyTorch Framework Logo
Tensors store numerical data.
Modules define network layers.
Autograd computes gradients.
FIG. Tensors, Modules, and Automatic Differentiation
PyTorch provides the data, model, and gradient tools needed to implement the training loop.
Tensors
A tensor is an array of numbers. This separate example stores two samples with three features each.
After the break: how should we change our modeling approach when labels are scarce or data are spread across sites?
Part IV. Modern Modeling Paradigms for Engineering AI
Choosing an approach that fits the engineering problem.
IV) Beyond One Dataset and One Model
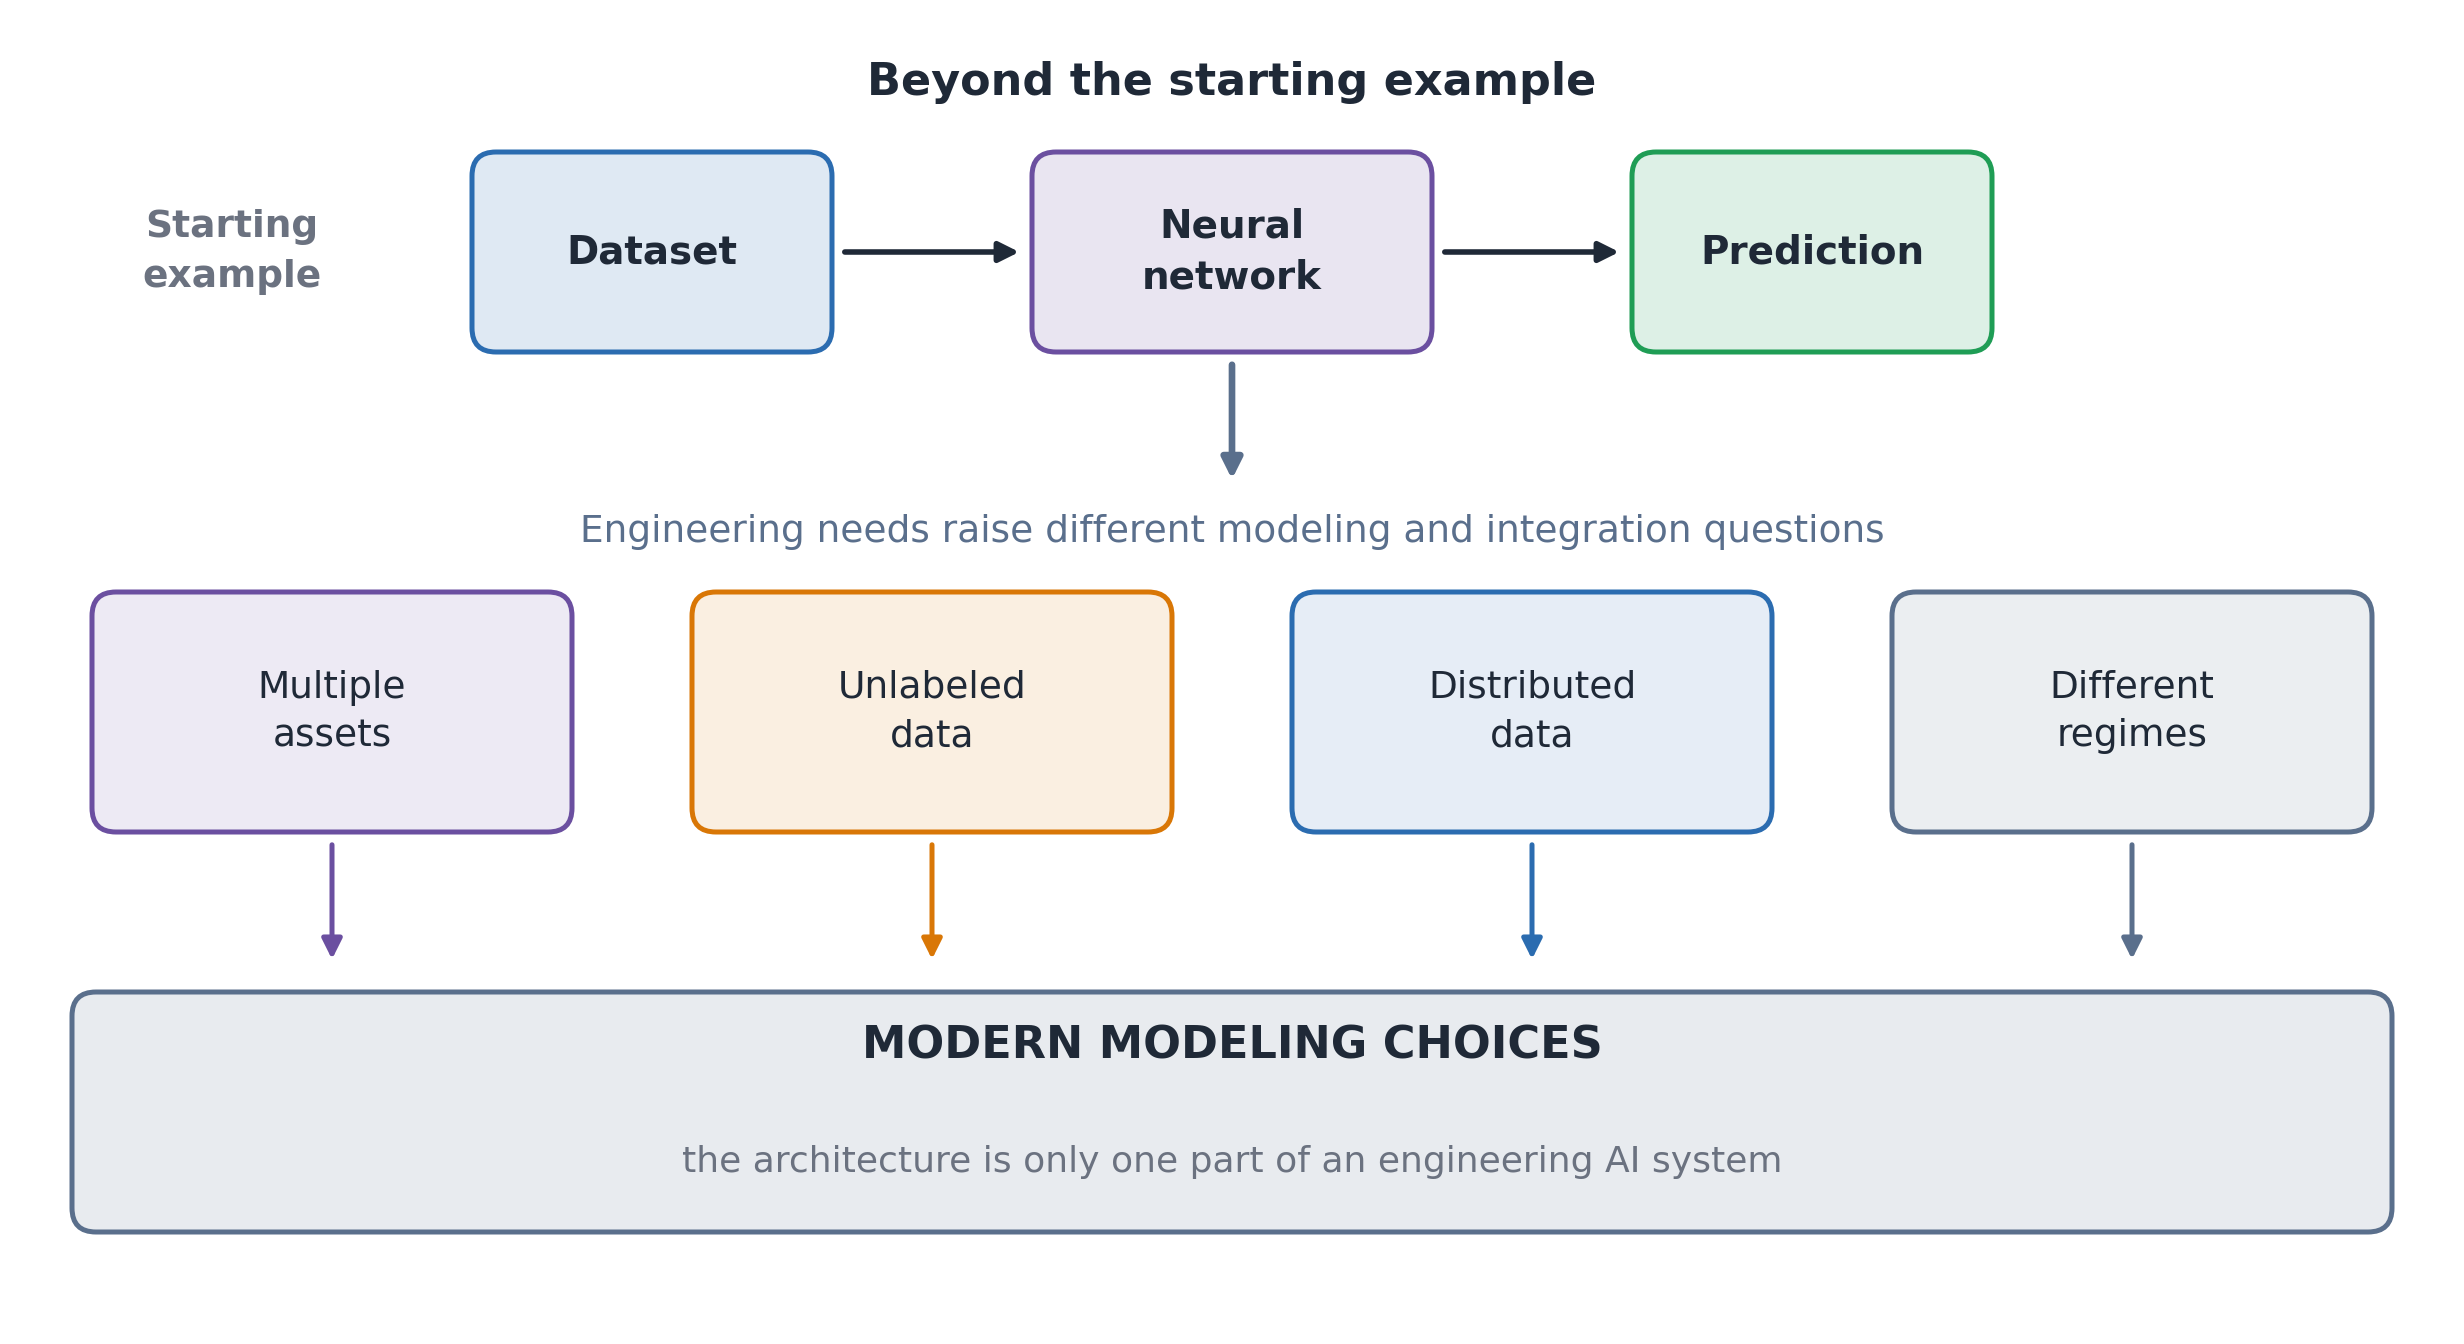
So far, we have used one dataset to train one predictor. Other situations raise new questions:
FIG. Learning Situations Beyond One Dataset and One Model
Choose the approach from the problem: available labels, related machines, and data-sharing limits. The next sections address these different needs.
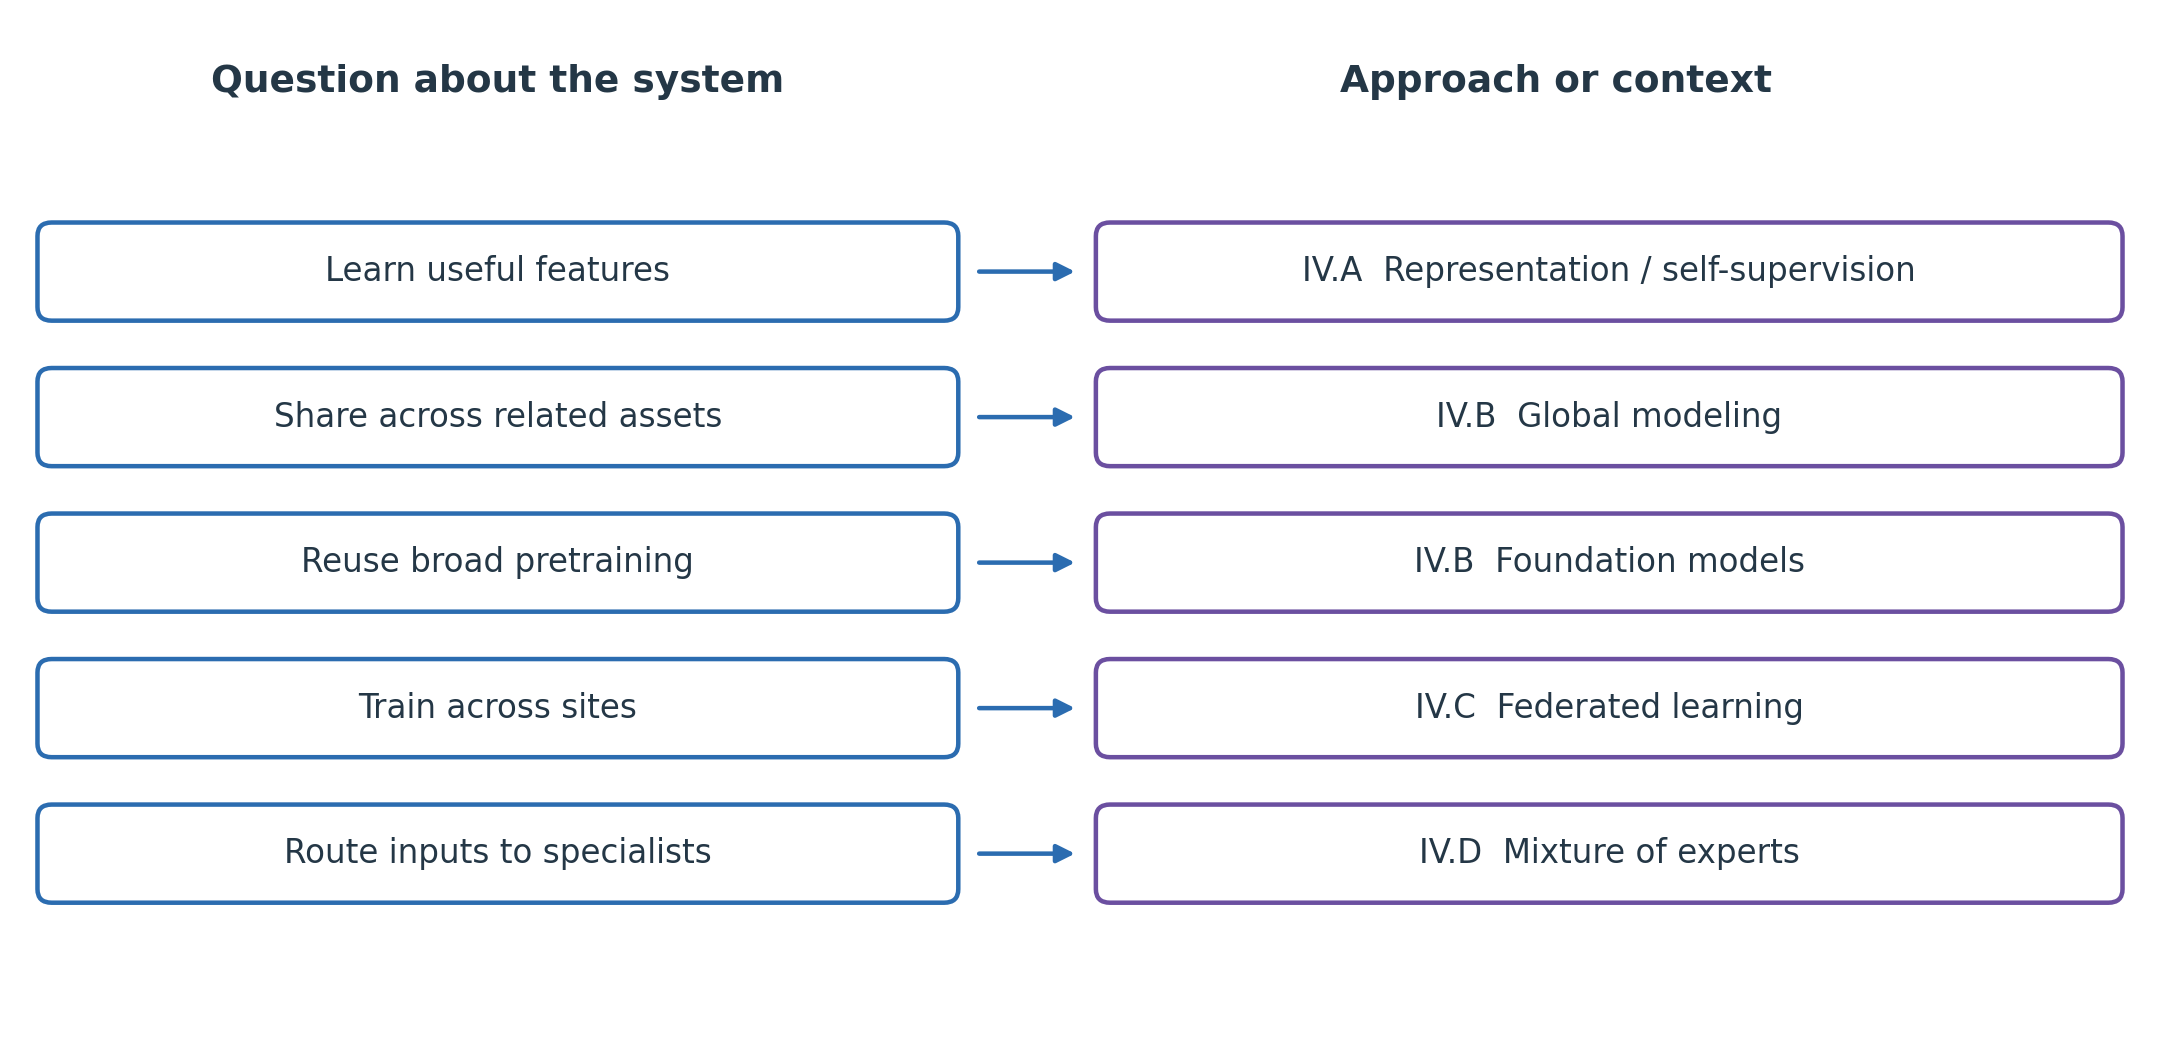
IV) A Map of Modeling Approaches
FIG. Different Questions About an AI System
These are different dimensions of a system. They can overlap and be combined.
IV.A) Representation Learning
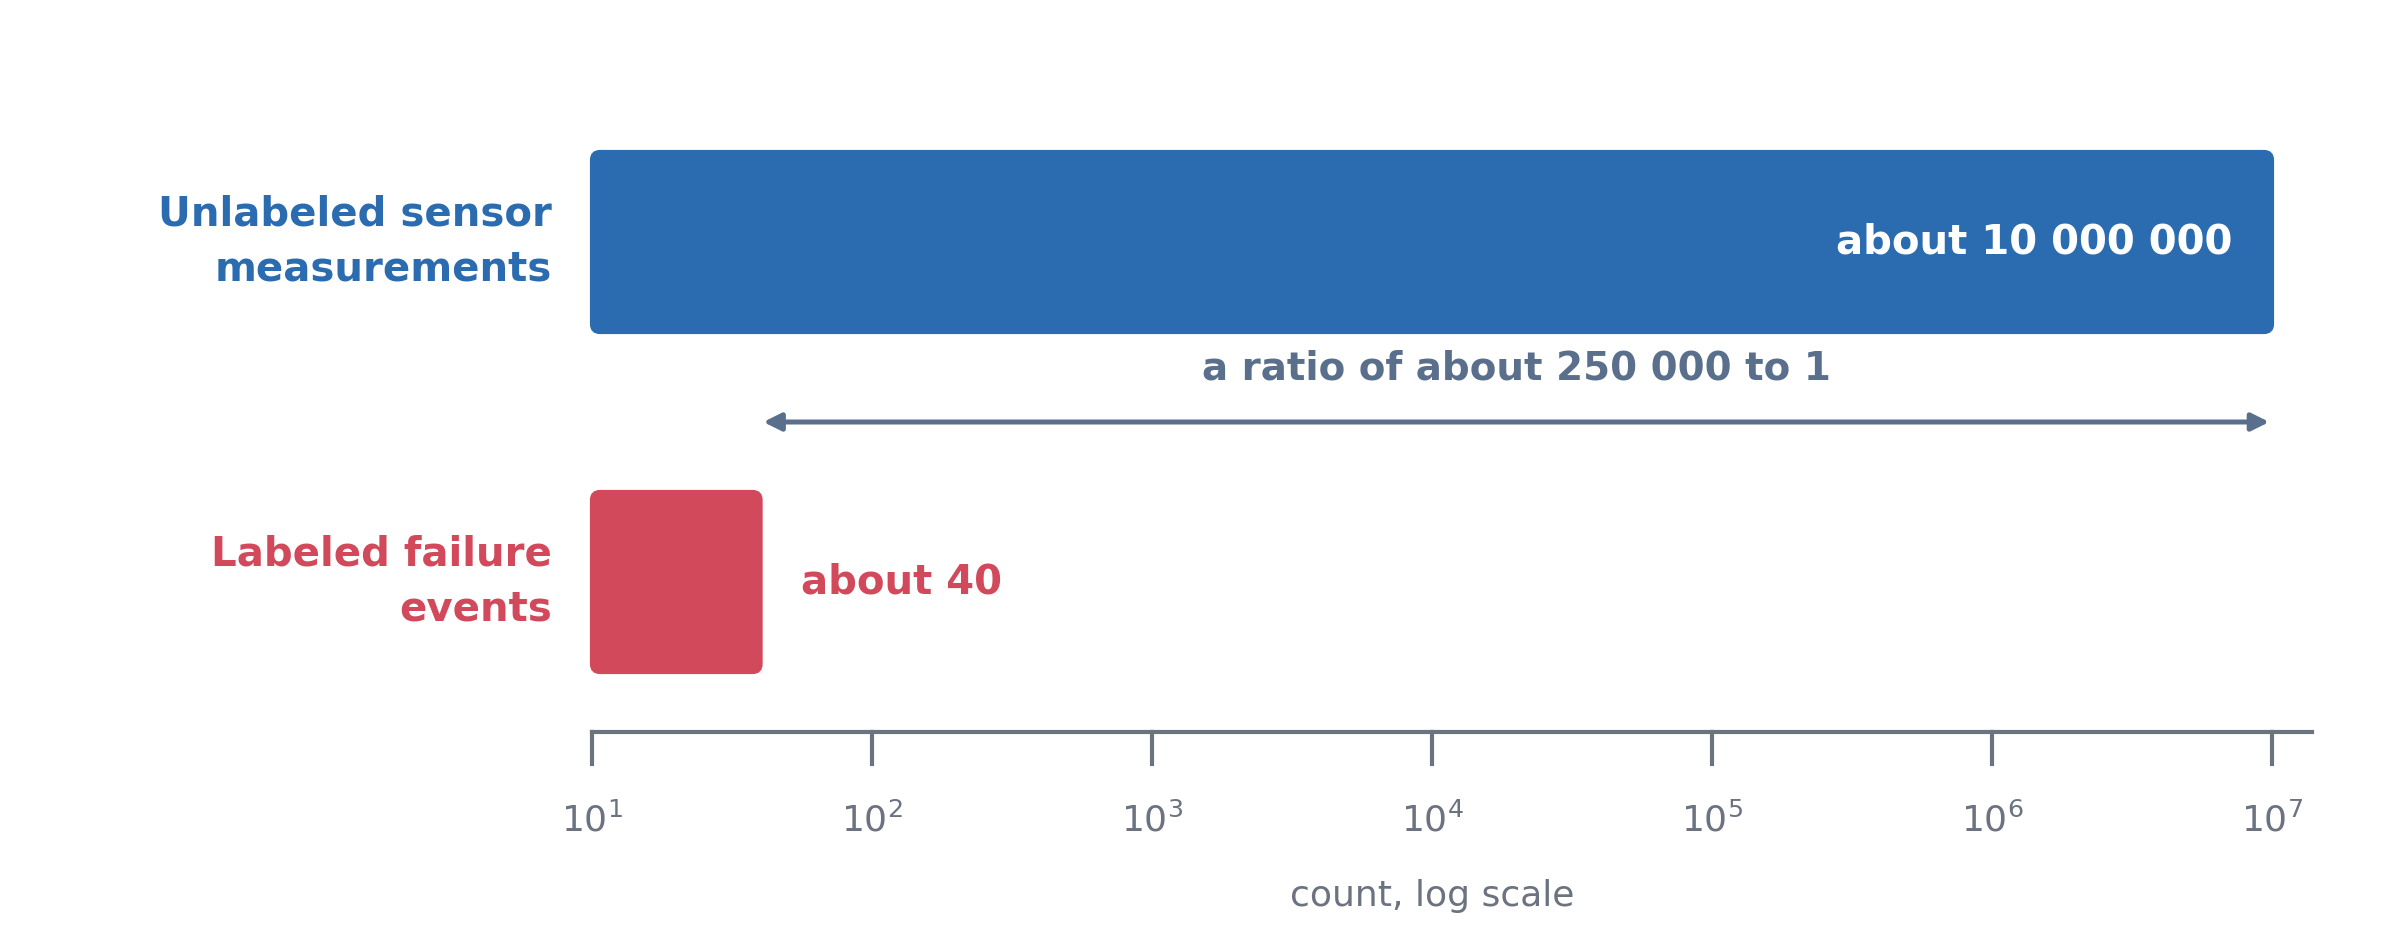
A label is a known target, such as a confirmed machine fault. Factories may collect years of sensor readings but record only a few confirmed faults.
FIG. Many Sensor Recordings but Few Confirmed Failures
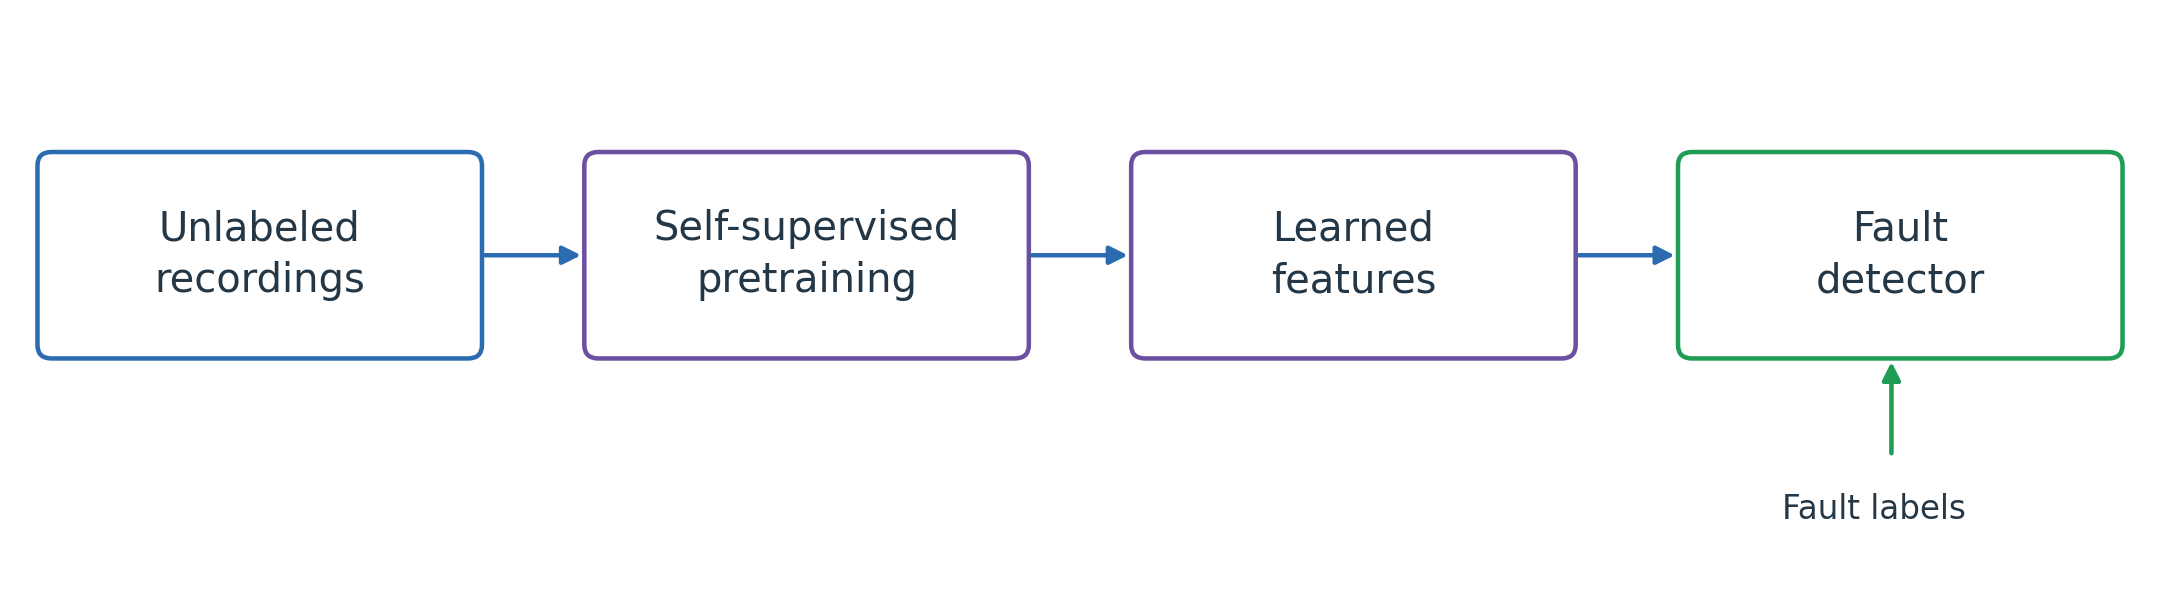
Representation learning learns useful features from data. Here, the aim is to learn from many unlabeled readings, then use the few fault labels to train a detector.
IV.A) From Measurements to Useful Features
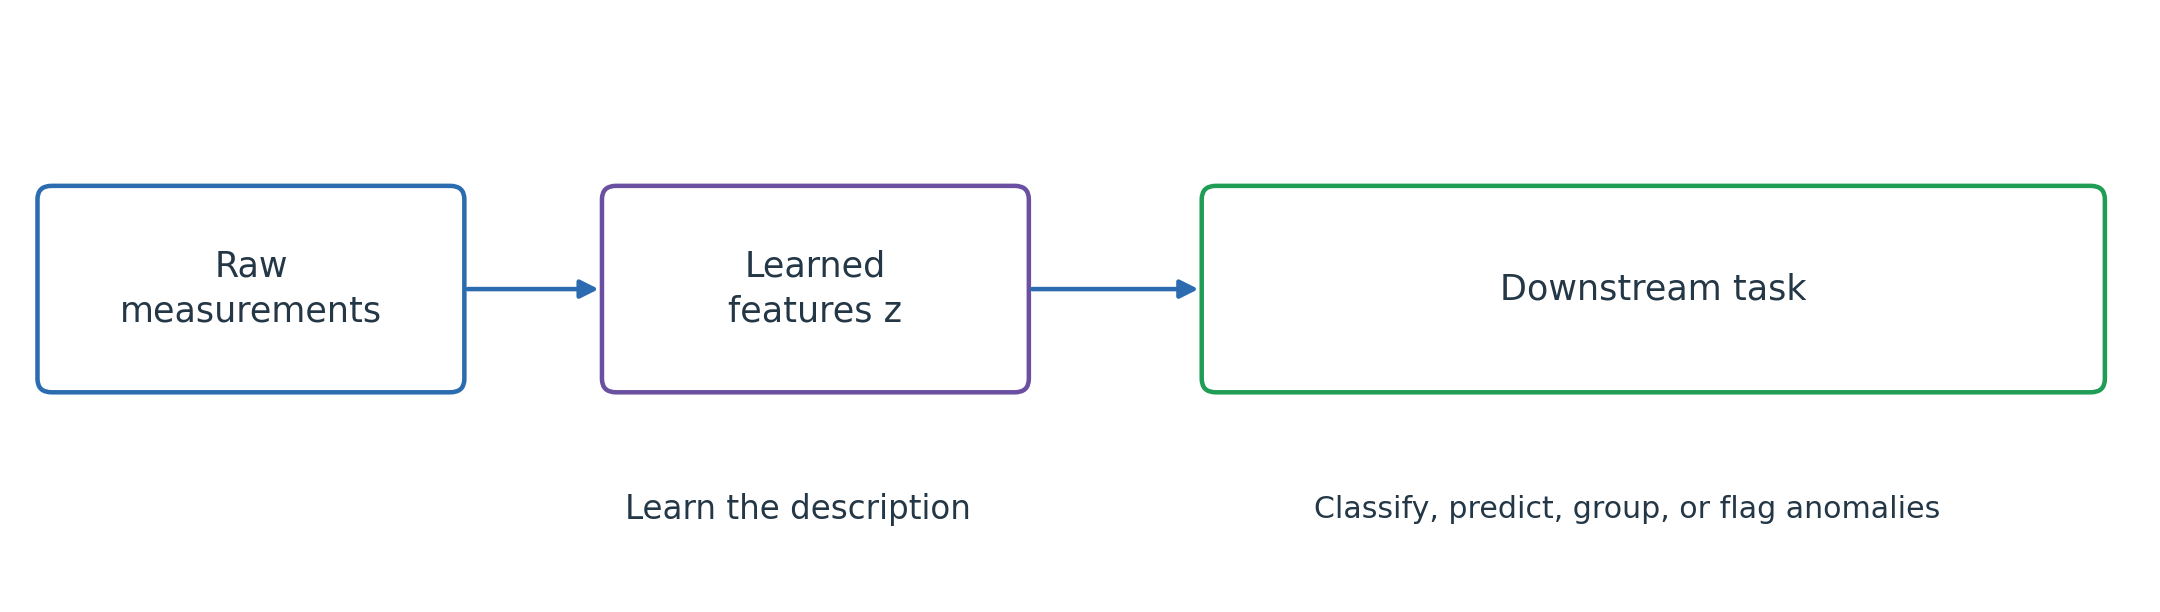
Representation learning learns features that help describe the input 1.
FIG. From Measurements to Features and Downstream Tasks
A downstream task uses those features for a later purpose, such as fault detection.
Autoencoders are one method. Representation learning can also use supervised or self-supervised training.
IV.A) Representation and Autoencoders
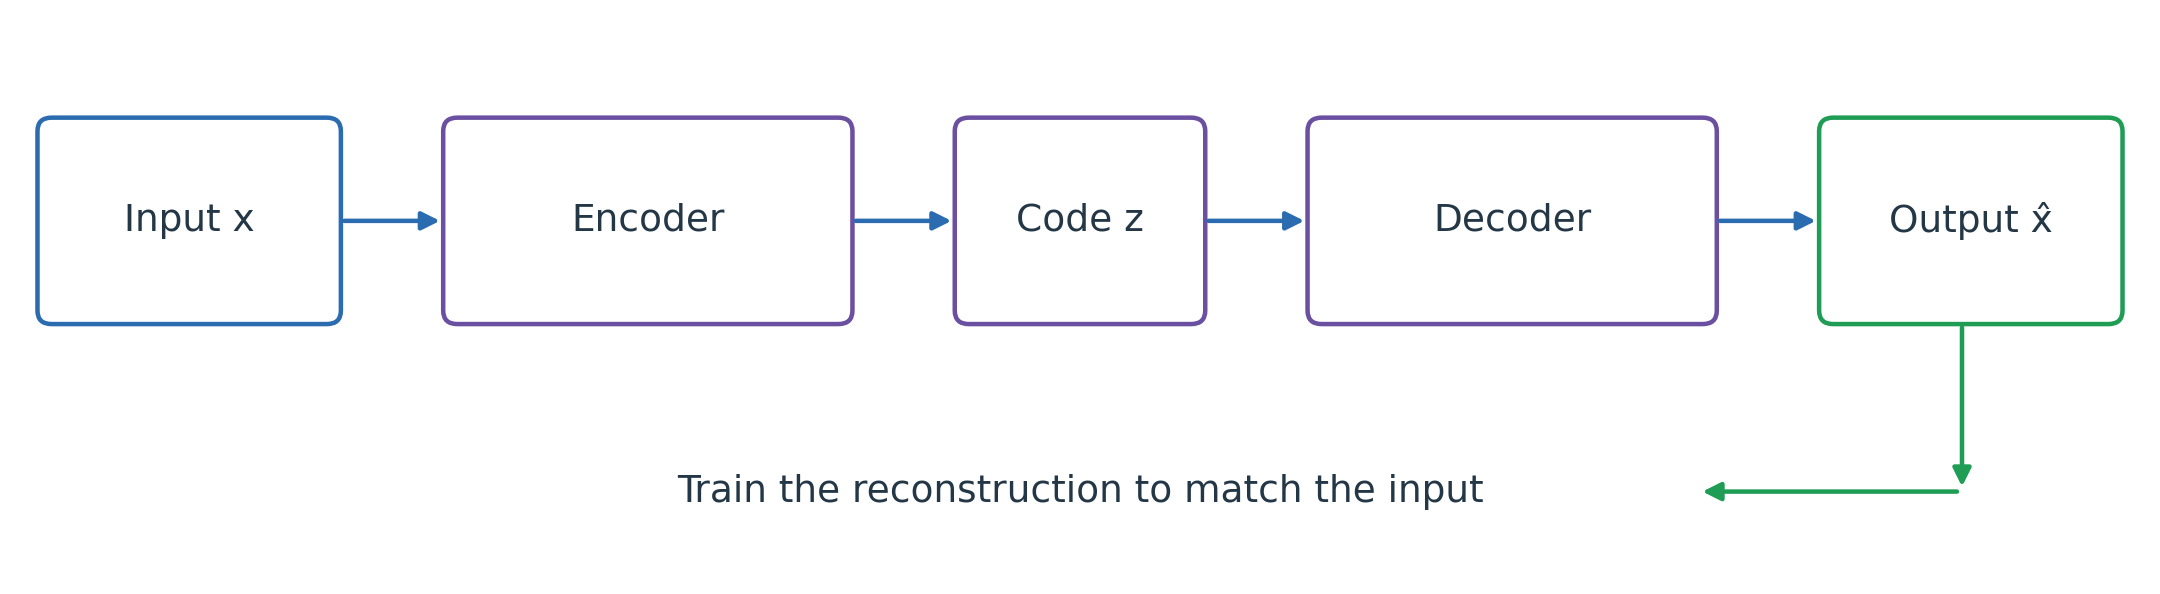
An autoencoder learns to reconstruct its input: \hat{x}\approx x.
FIG. Encoder, Latent Code, and Reconstruction
The encoder maps x to learned features z, the latent code. The decoder reconstructs \hat{x} from z.
A compact code encourages the model to preserve structure needed for reconstruction. Training minimizes \lVert x-\hat{x}\rVert^2: the sum of squared reconstruction differences. Check whether z helps the intended task.
IV.A) Three Autoencoder Variants
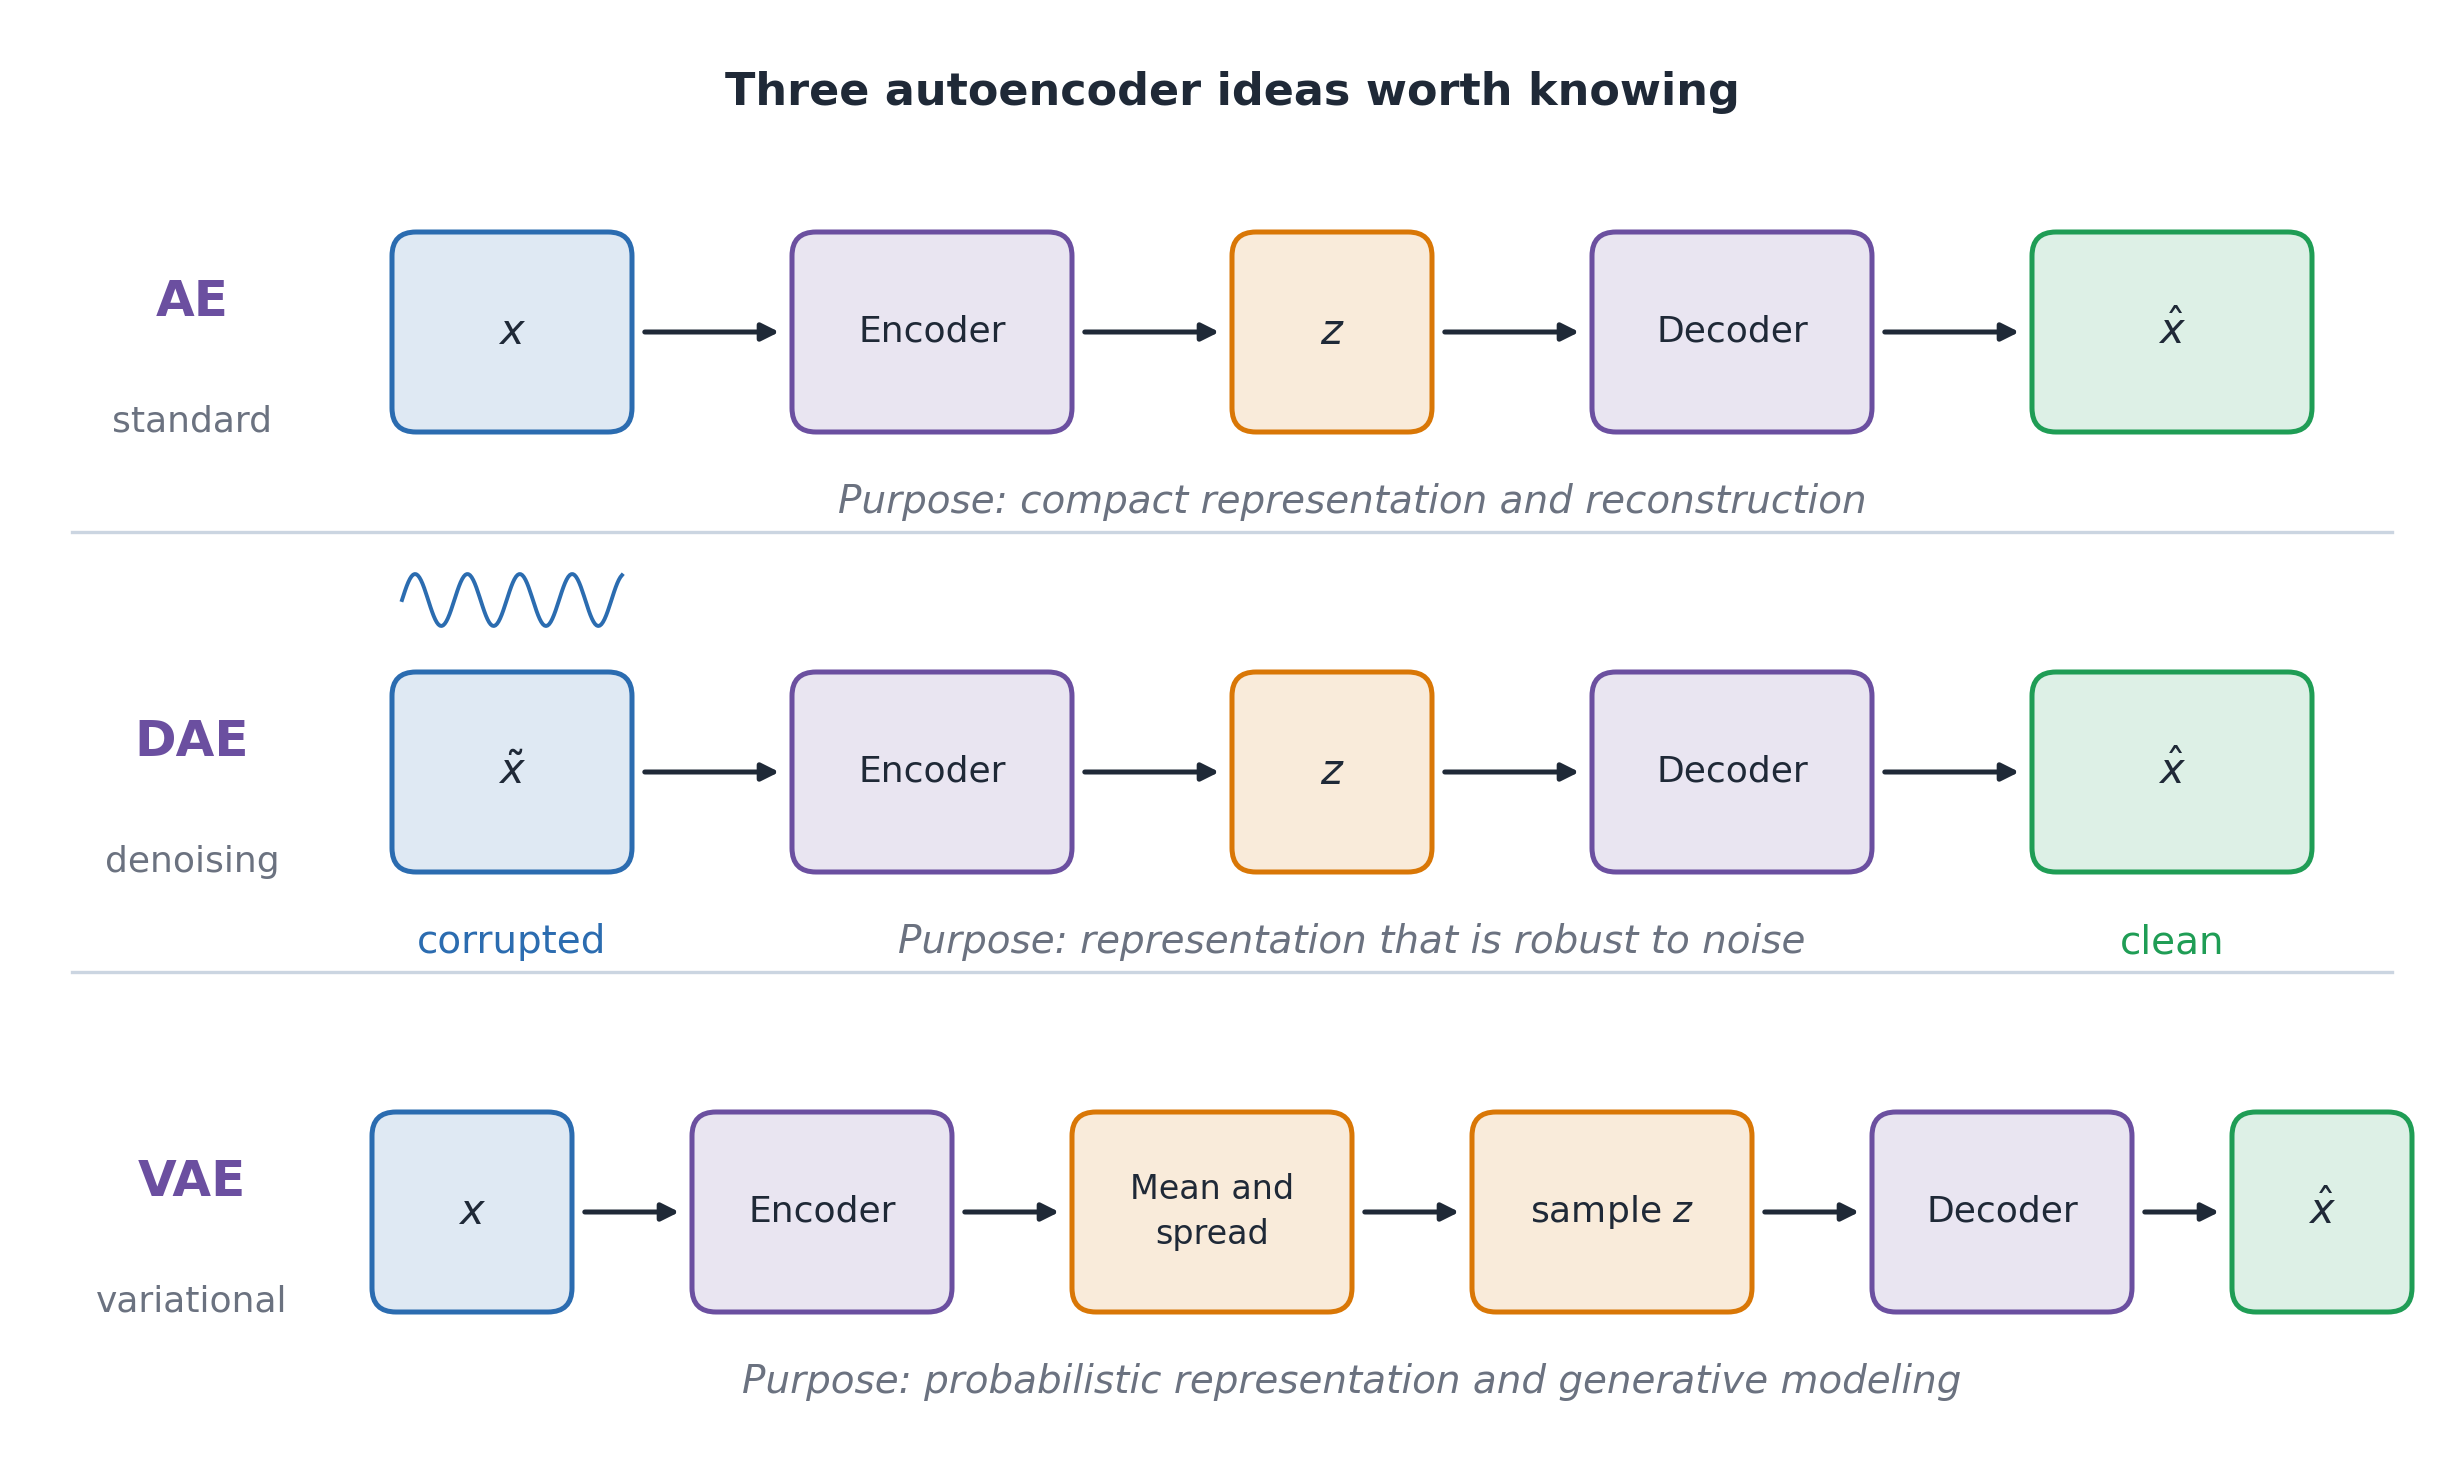
FIG. Standard, Denoising, and Variational Autoencoders
Standard autoencoder: reconstruct the input.
Denoising autoencoder: reconstruct a clean input from a corrupted version.
Variational autoencoder (VAE): learn a probabilistic latent representation that supports generation.
Choose the training task to match the aim: reconstruct inputs, remove noise, or learn to generate samples.
IV.A) Self-Supervised Learning
Supervised learning: use known task labels. Self-supervised learning: construct targets from the data themselves.
Hide a sensor reading and predict it from the others.
Use earlier time-series observations to predict a later region.
FIG. Self-Supervised Pretraining Followed by Fault Detection
Self-supervision is broader than autoencoders. The training task should preserve information useful for the downstream task.
IV.B) Local and Global Models
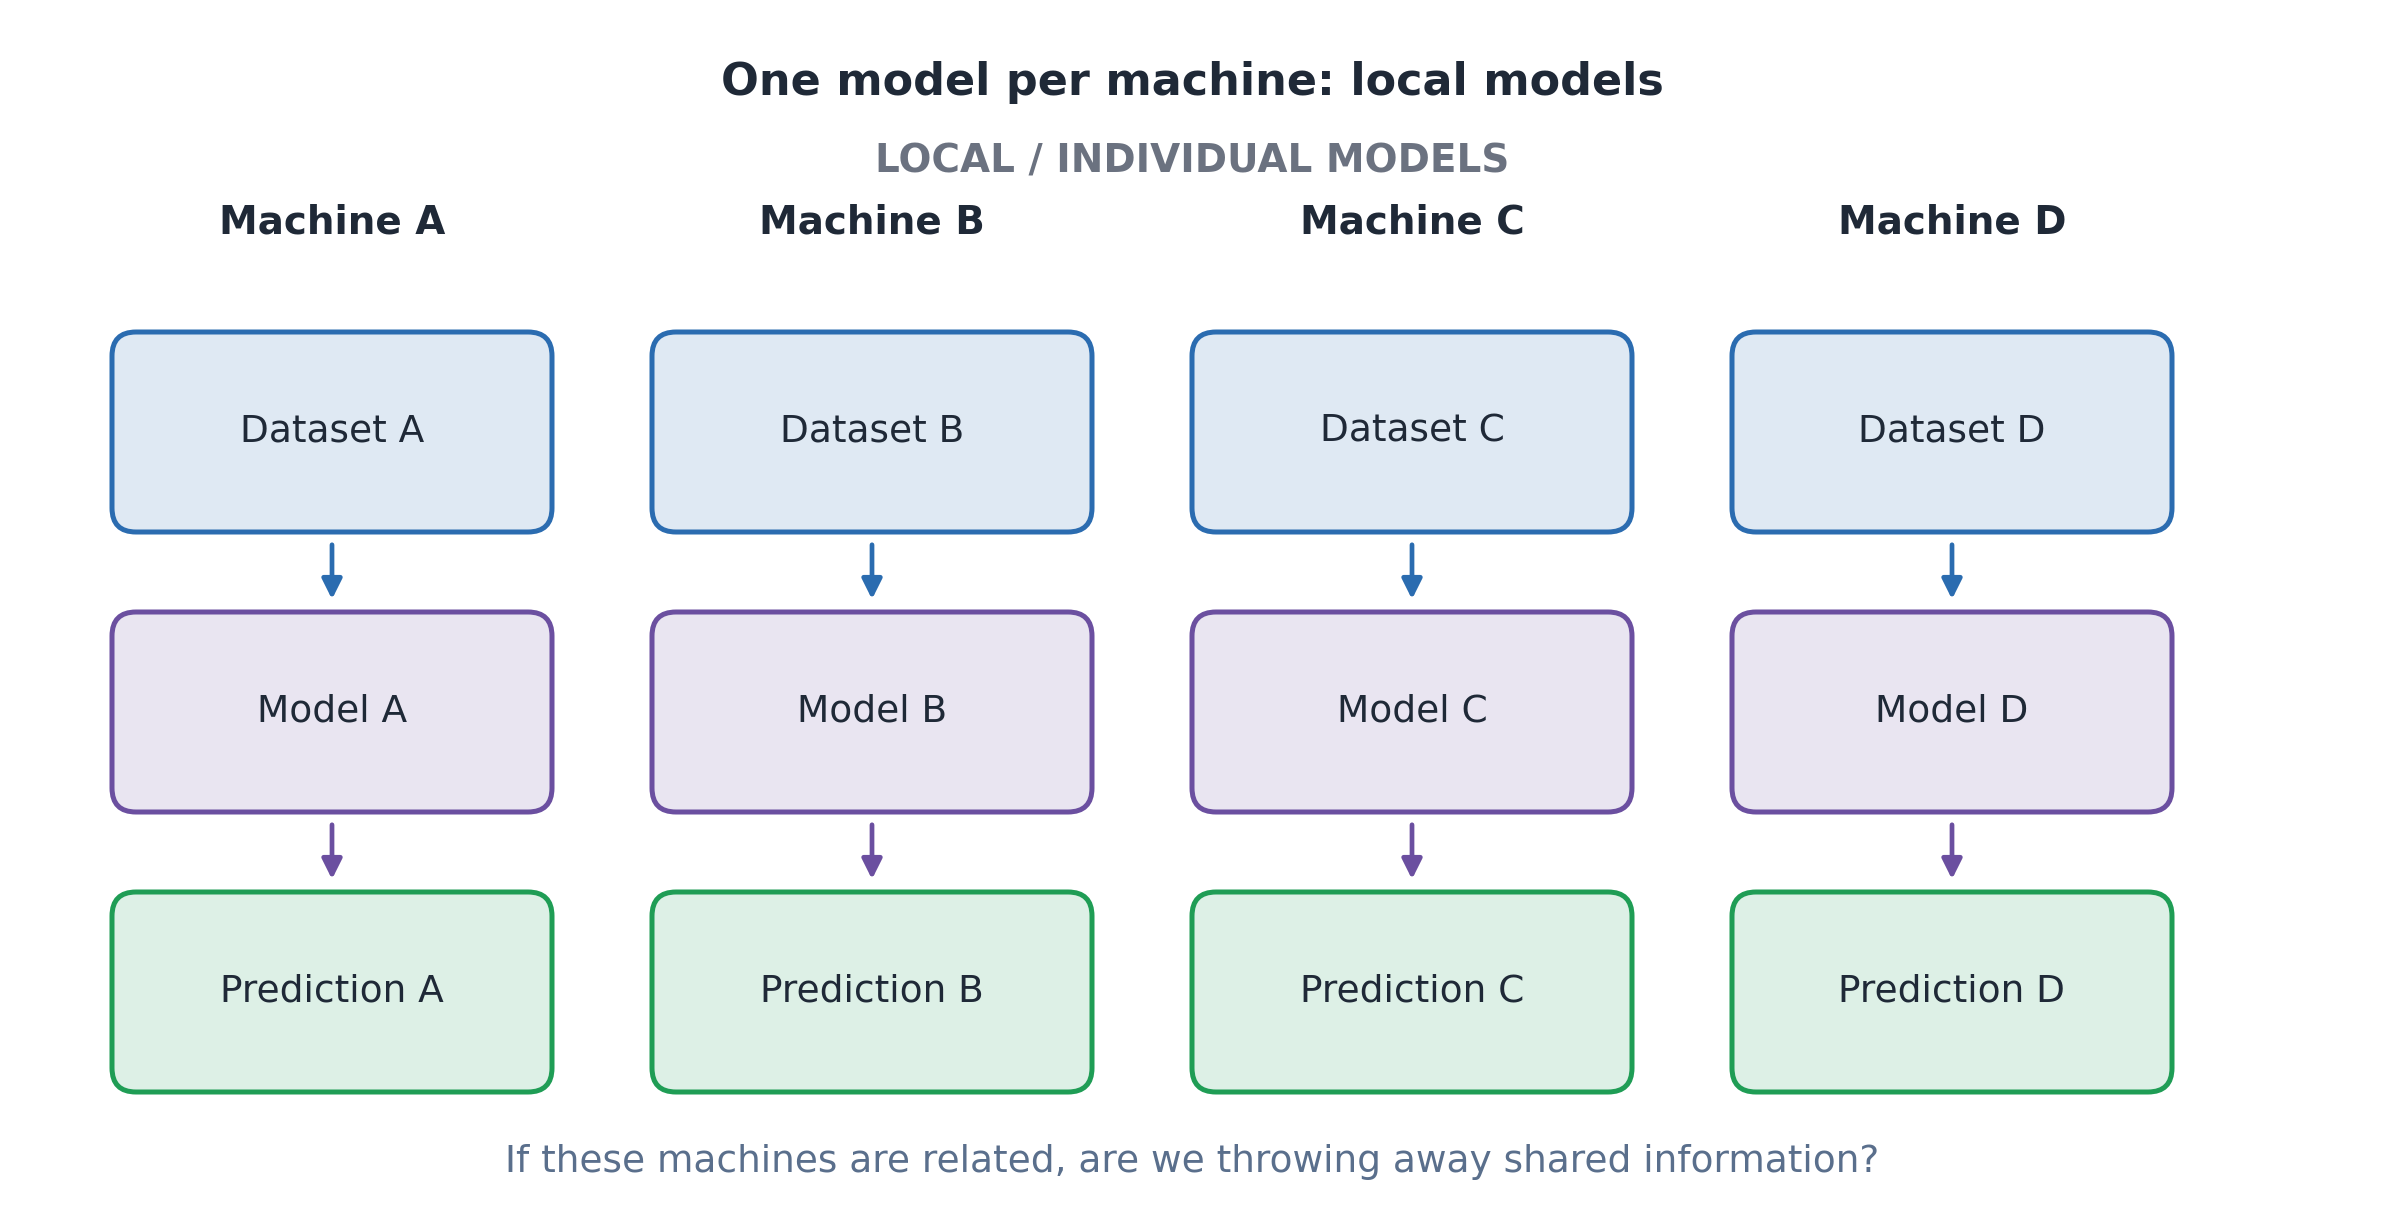
Suppose a company operates many similar pumps. Should each pump have its own prediction model?
FIG. Separate Models for Individual Machines
A local model is trained for one asset. It can capture that pump’s behavior, but may have little data. If each pump has little history, consider learning across related pumps.
IV.B) Global Modeling
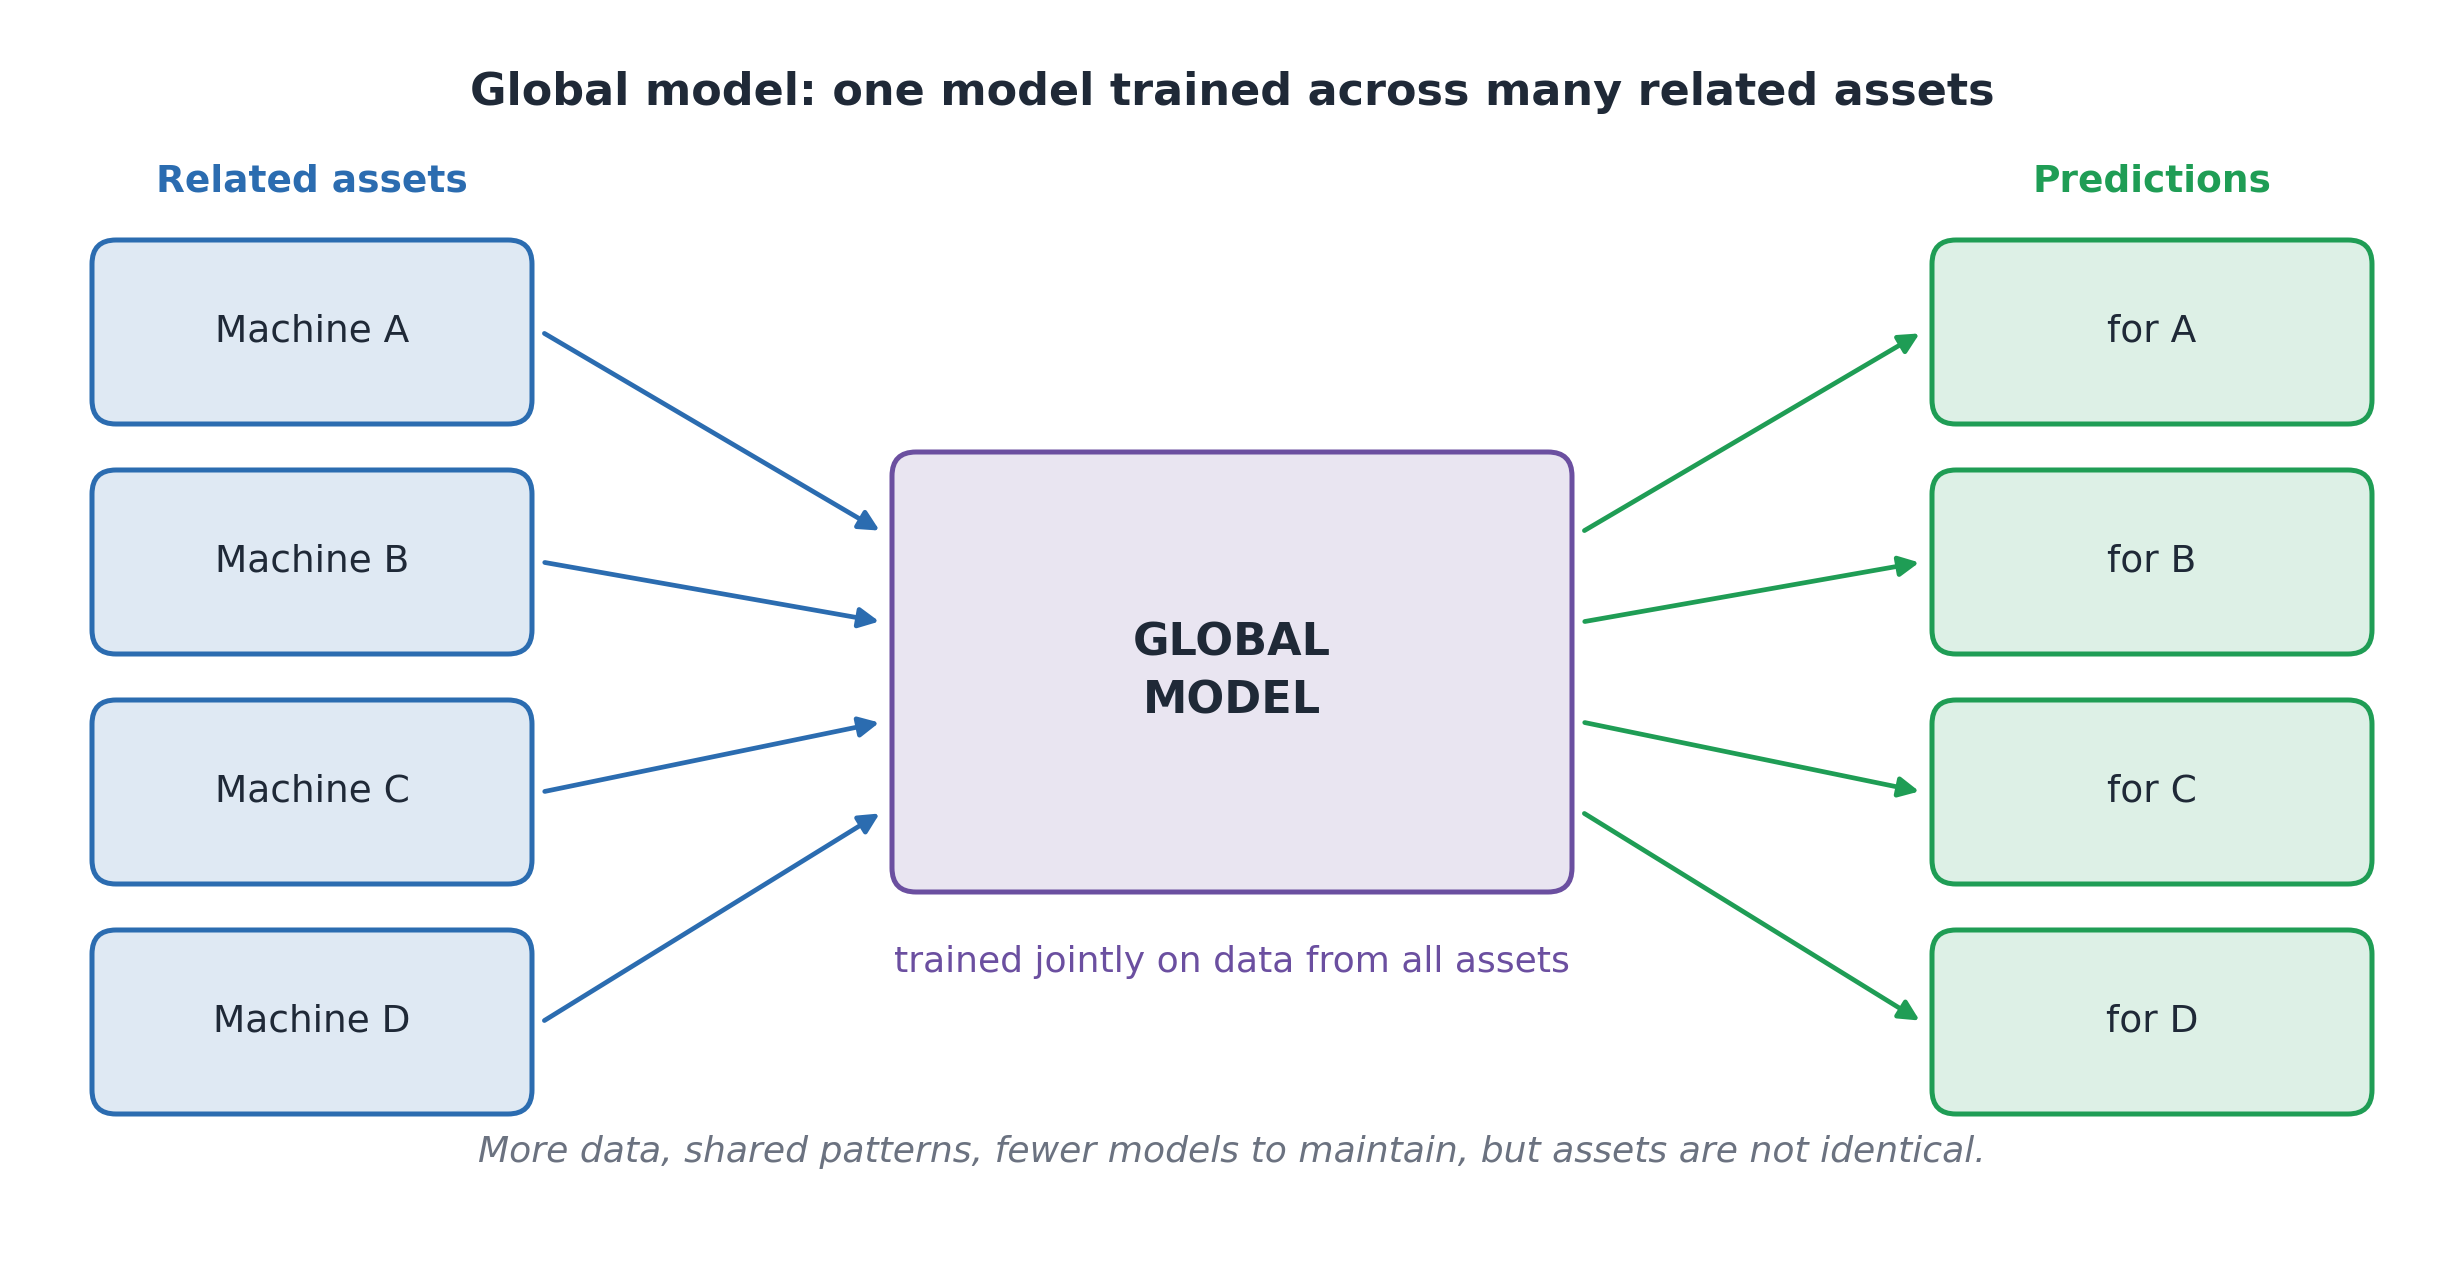
A global model learns from several related assets and makes predictions for them 3.
FIG. One Model Learns Across Several Machines
Shared data may help when each asset has little history. However, machines can differ in age, load, and environment.
Compare performance for each asset, as well as overall.
IV.B) Global and Foundation Models
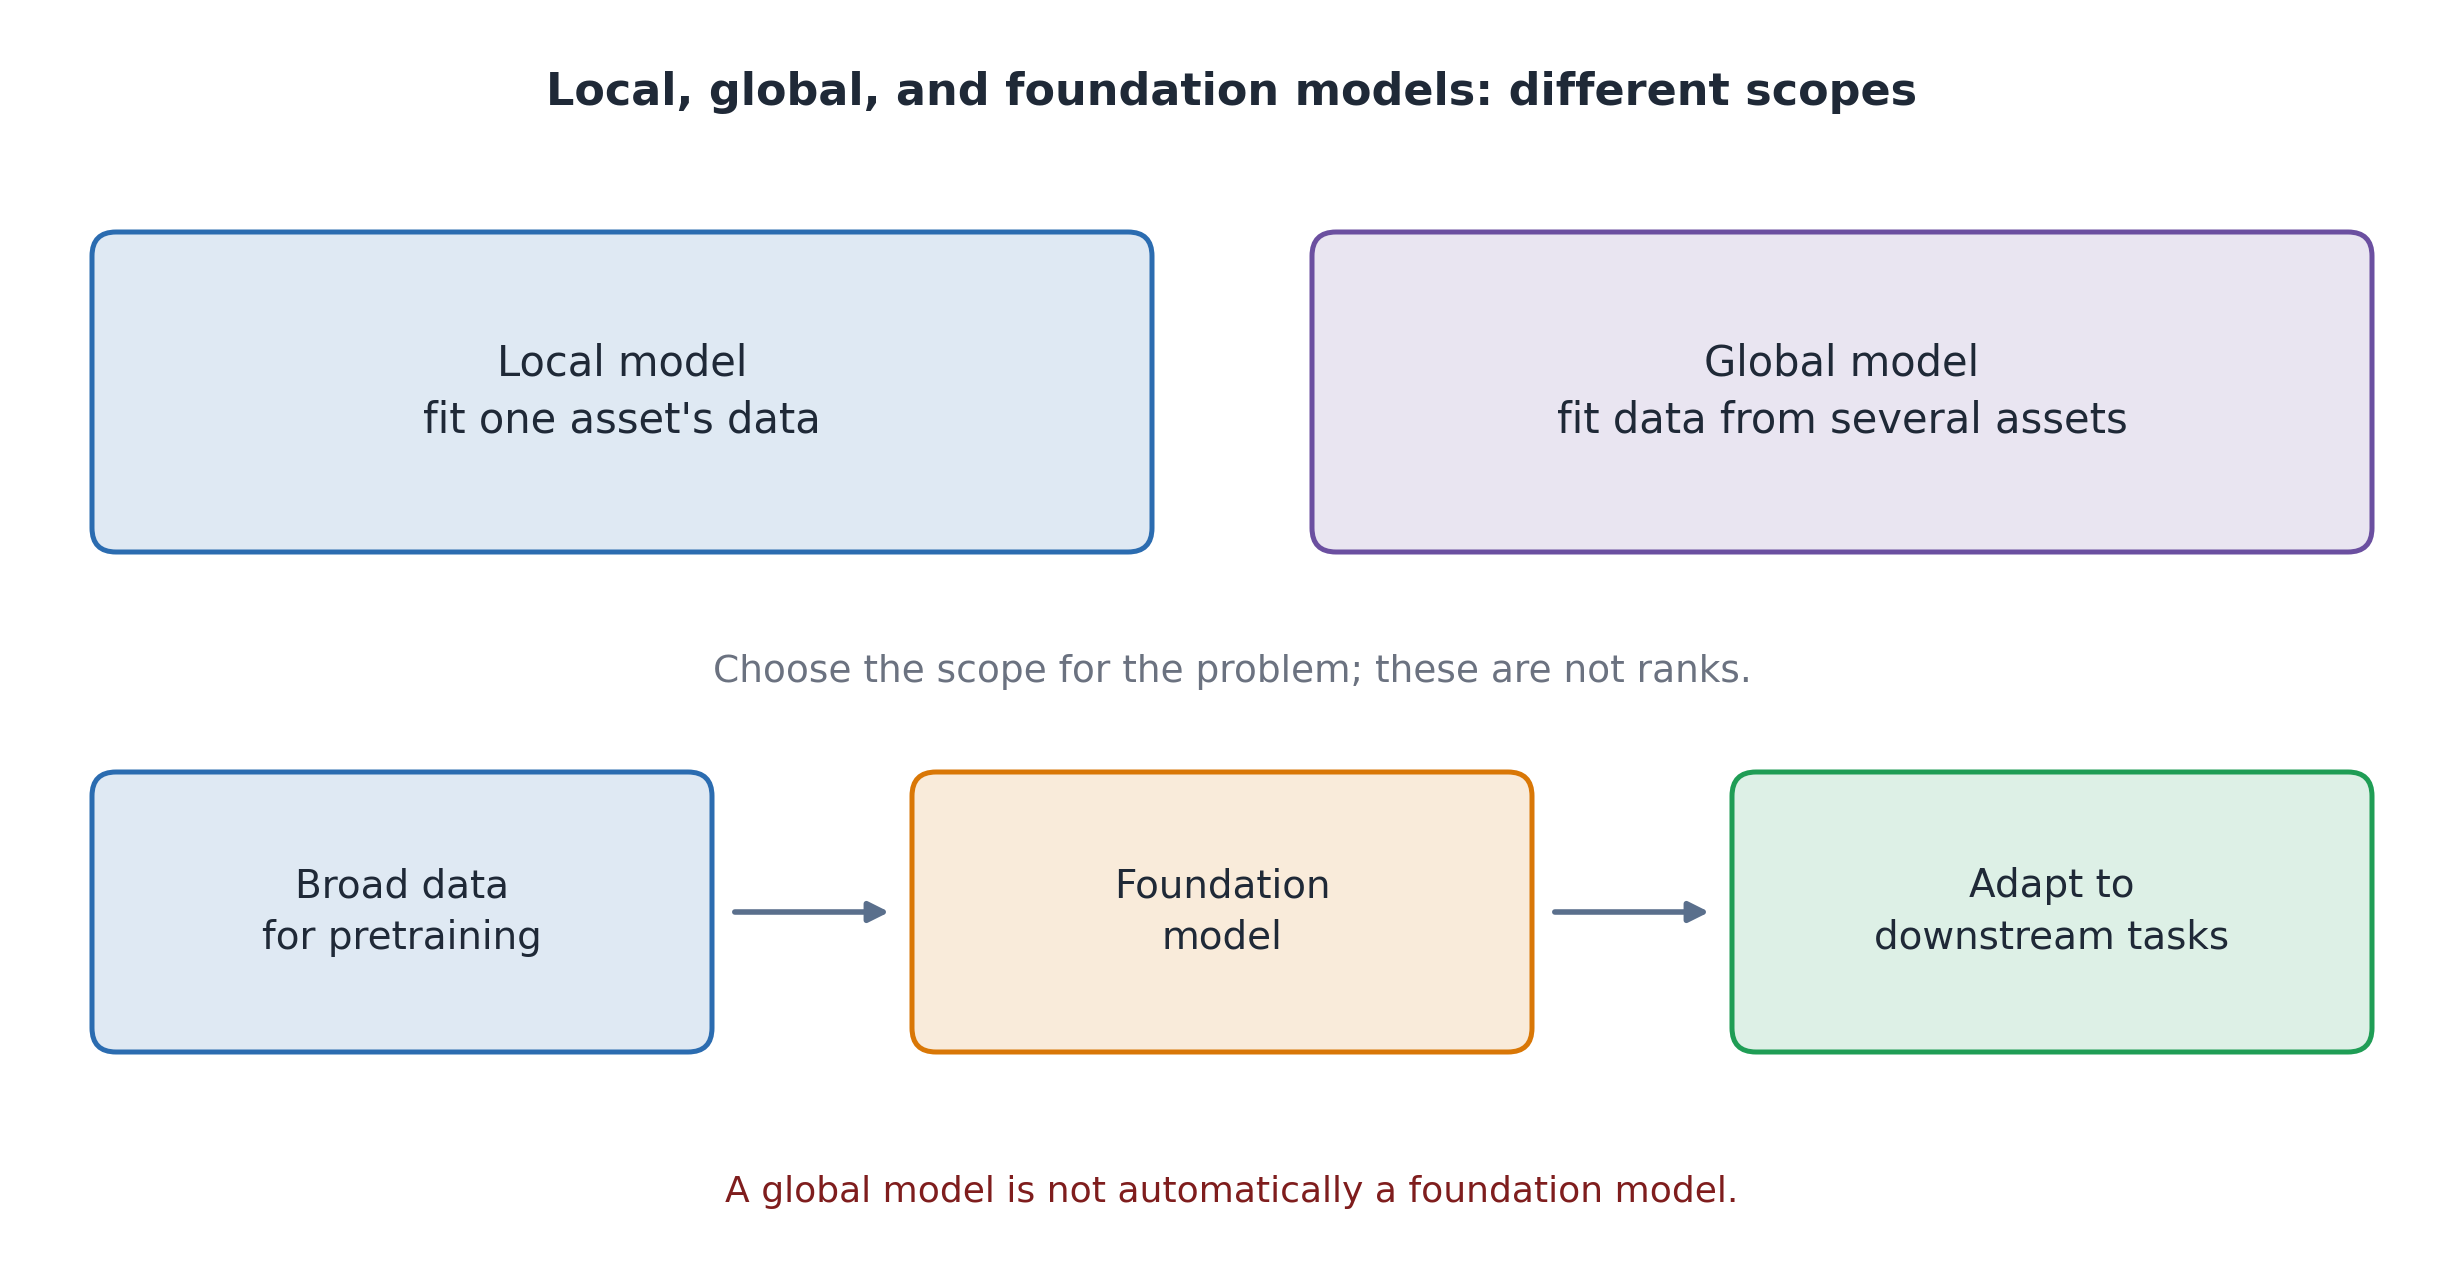
A global model shares learning across related assets. A foundation model is trained broadly so it can be adapted to many tasks 4.
FIG. Global Modeling and Foundation-Model Pretraining
Pretraining is the initial learning stage. Adaptation, such as fine-tuning, prepares the model for a particular task.
Global modeling shares learning across assets; foundation models support reuse across tasks.
IV.B) Global vs Foundation: What Is Shared?
TABLE. Global Models and Foundation Models
Question
Global model
Foundation model
Main purpose
Share learning across related assets
Reuse broad pretraining across tasks
Example data
Histories from many pumps
Broad, diverse sensor recordings
Example use
One fault-prediction task across pumps
Adapt to forecasting or fault diagnosis
Further training
May be trained for the shared task
Fine-tuning updates pretrained parameters
More data alone do not turn a global model into a foundation model.
Pretraining builds reusable knowledge; adaptation applies it to a target task. Fine-tuning is one form of adaptation.
IV.B) Foundation Models for Engineering
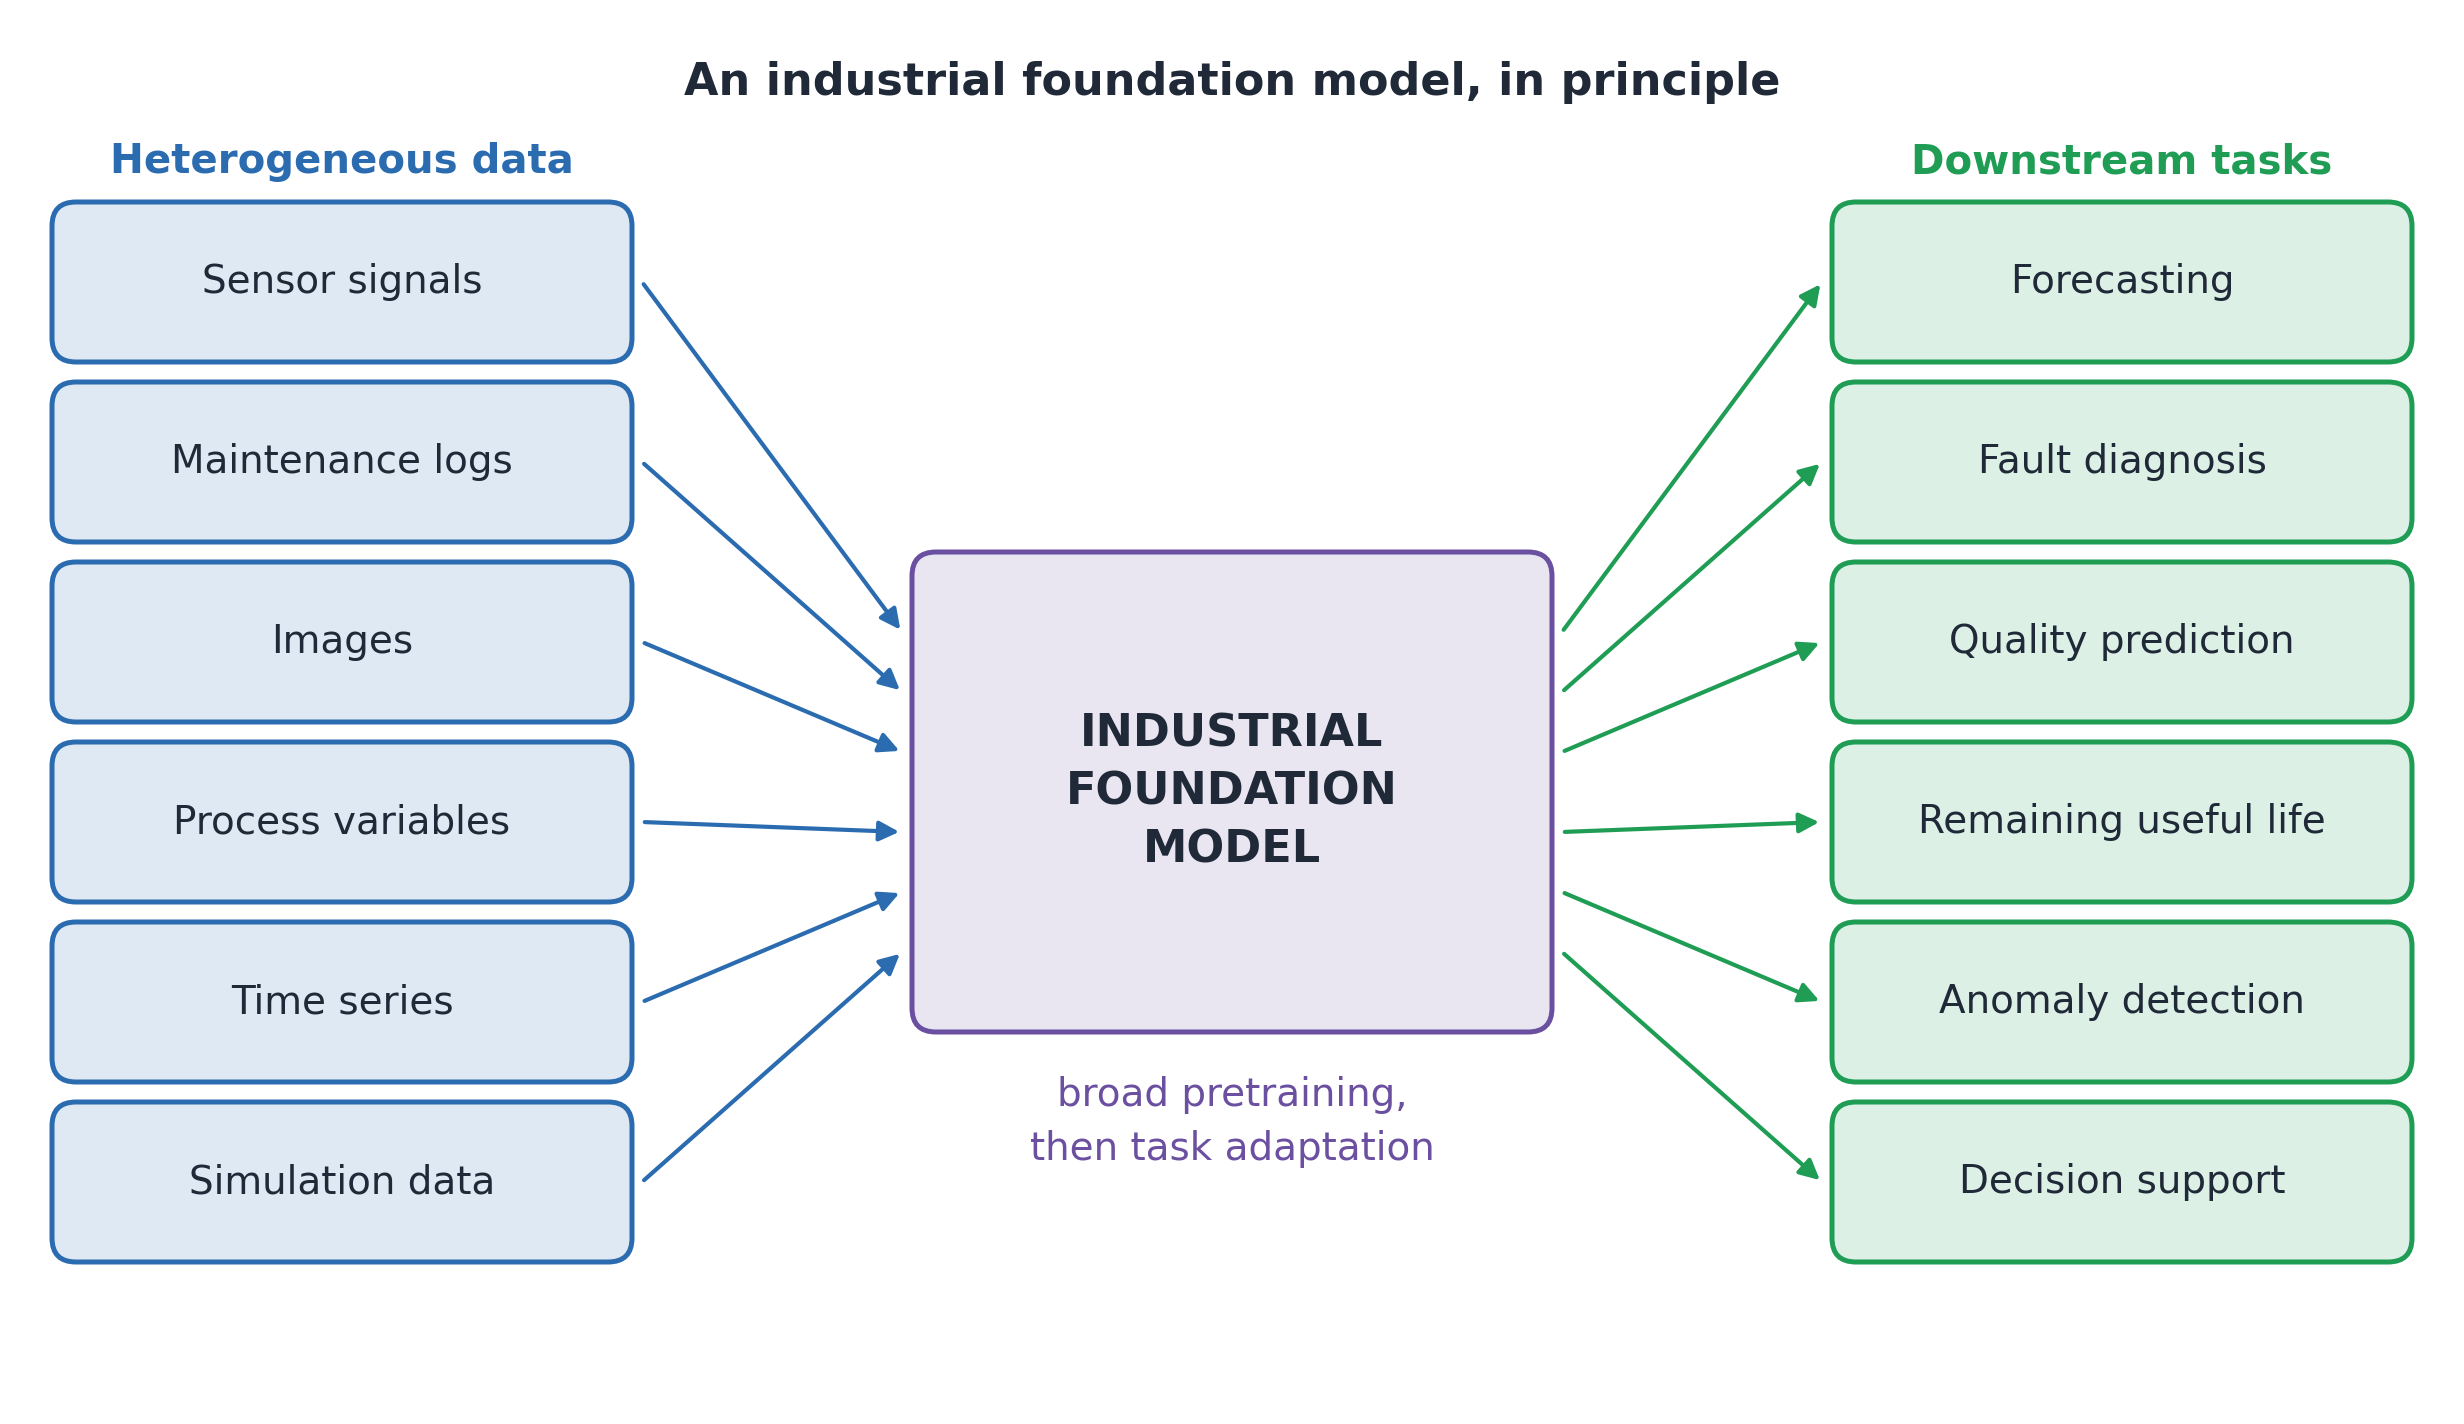
A model pretrained on broad engineering data could be adapted to tasks such as fault detection or forecasting.
FIG. Foundation Models for Engineering Tasks
Before using it, check whether its training data resemble your application: sensors, units, equipment, and operating conditions may differ.
Compare the adapted model with established methods on your own task.
IV.C) Federated Learning
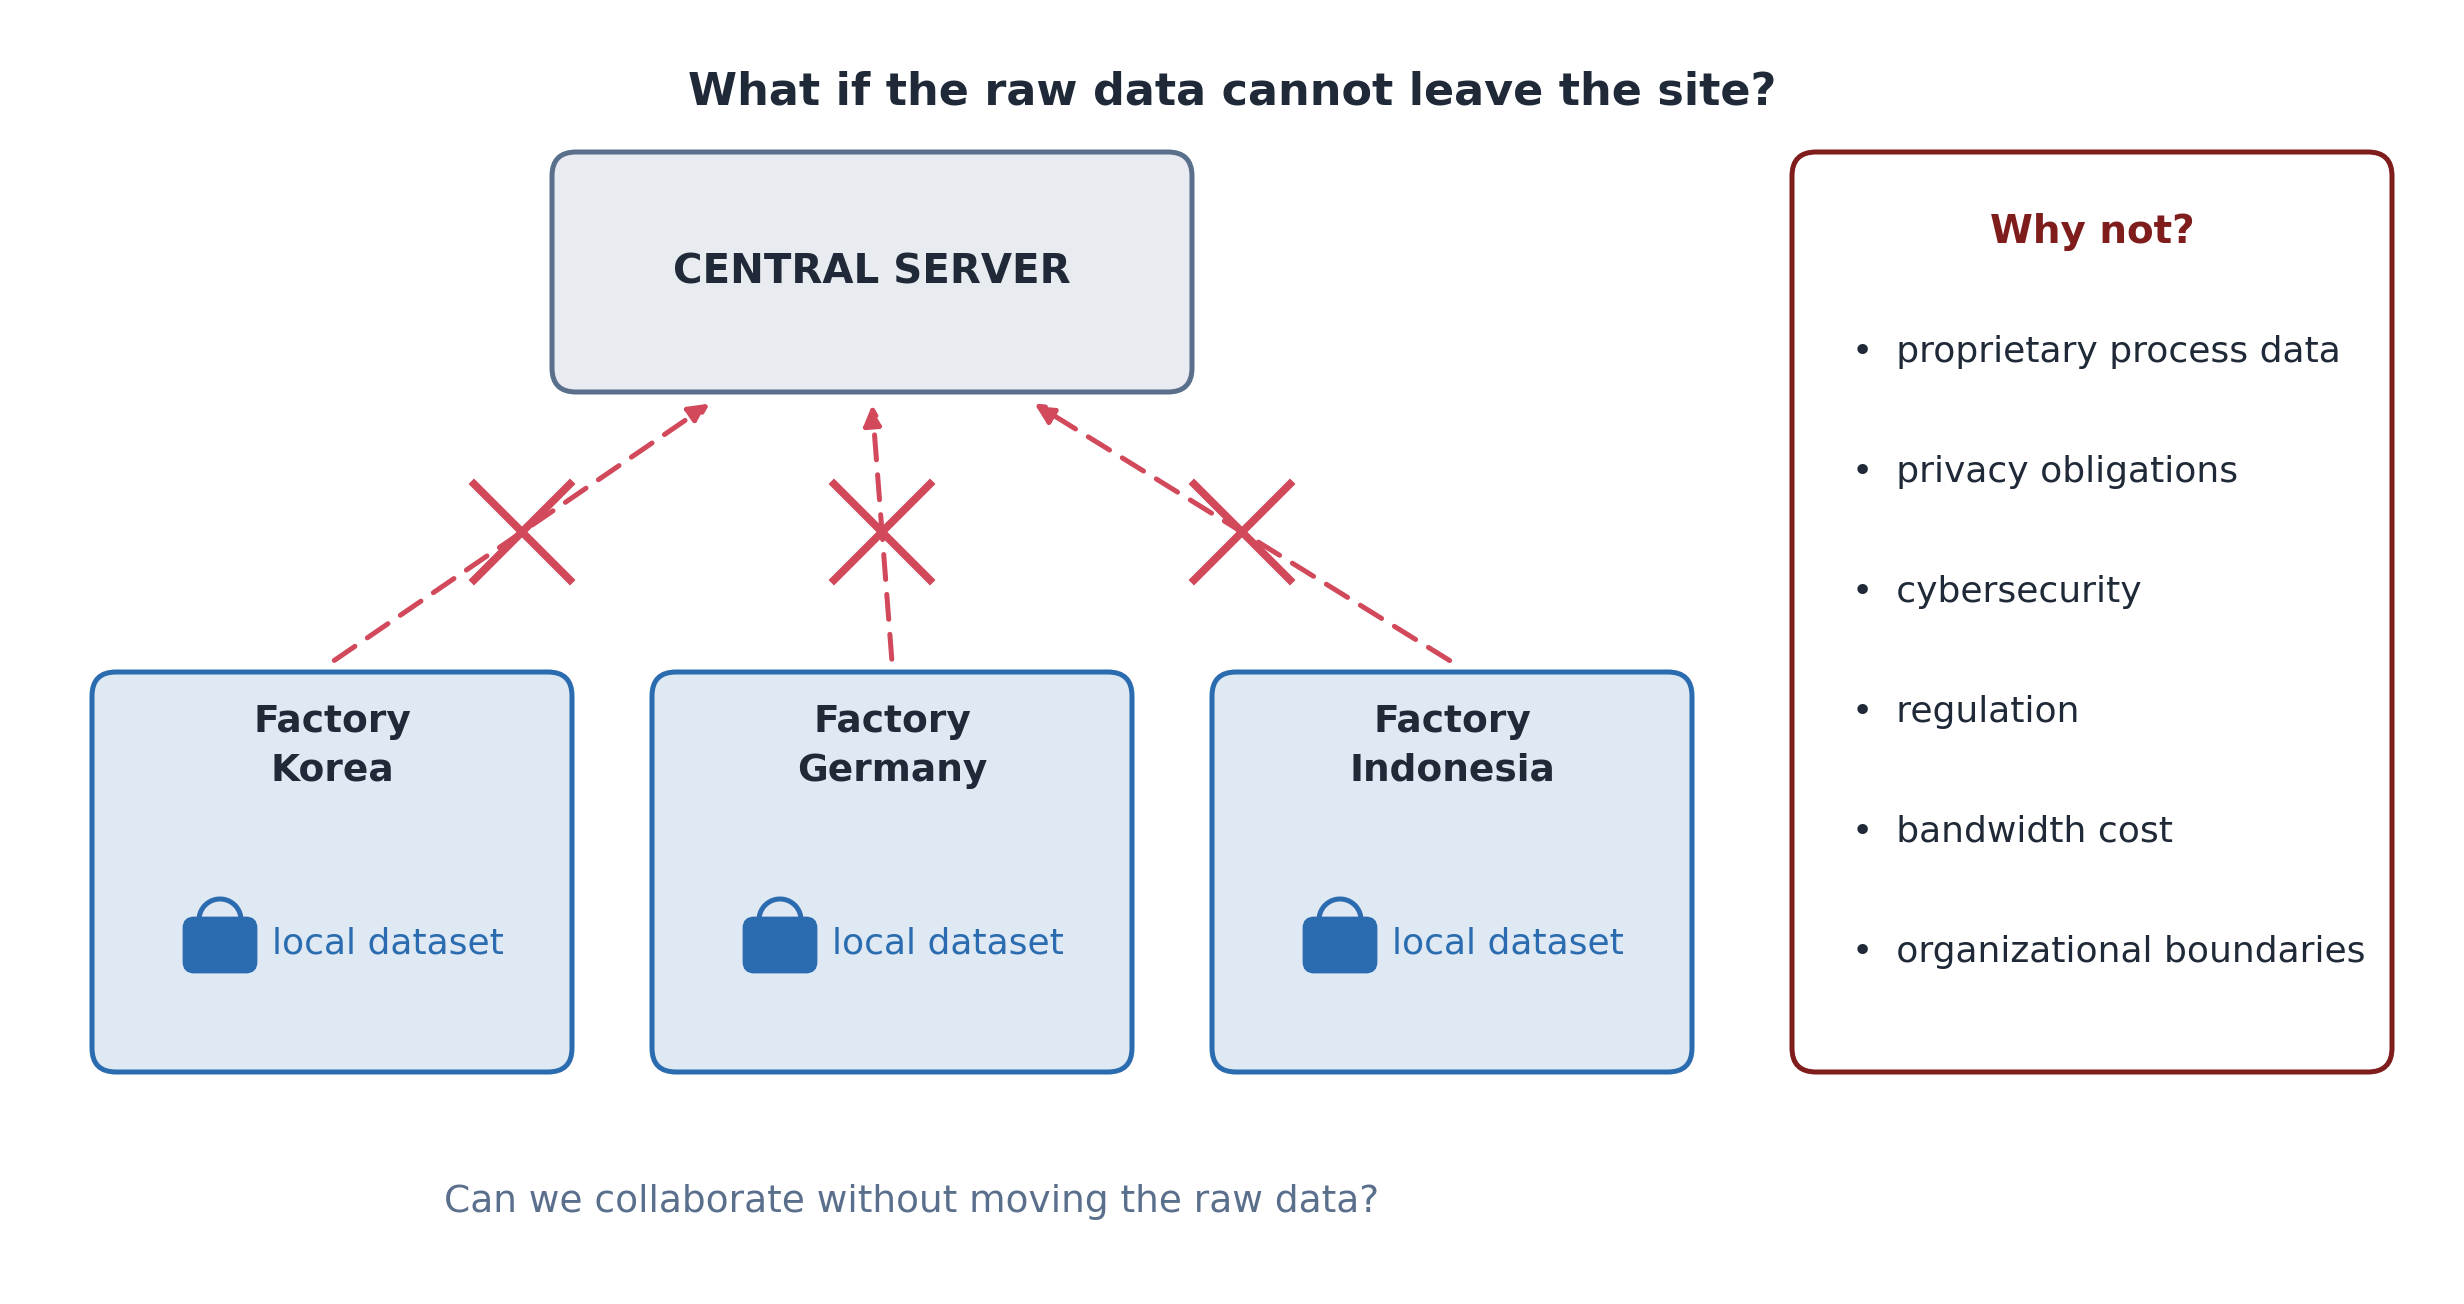
Several factories have useful data but cannot pool their raw records. Can they learn together?
Federated learning trains a shared model across sites without collecting their raw training data in one place.
FIG. Factories Hold Their Training Data Locally
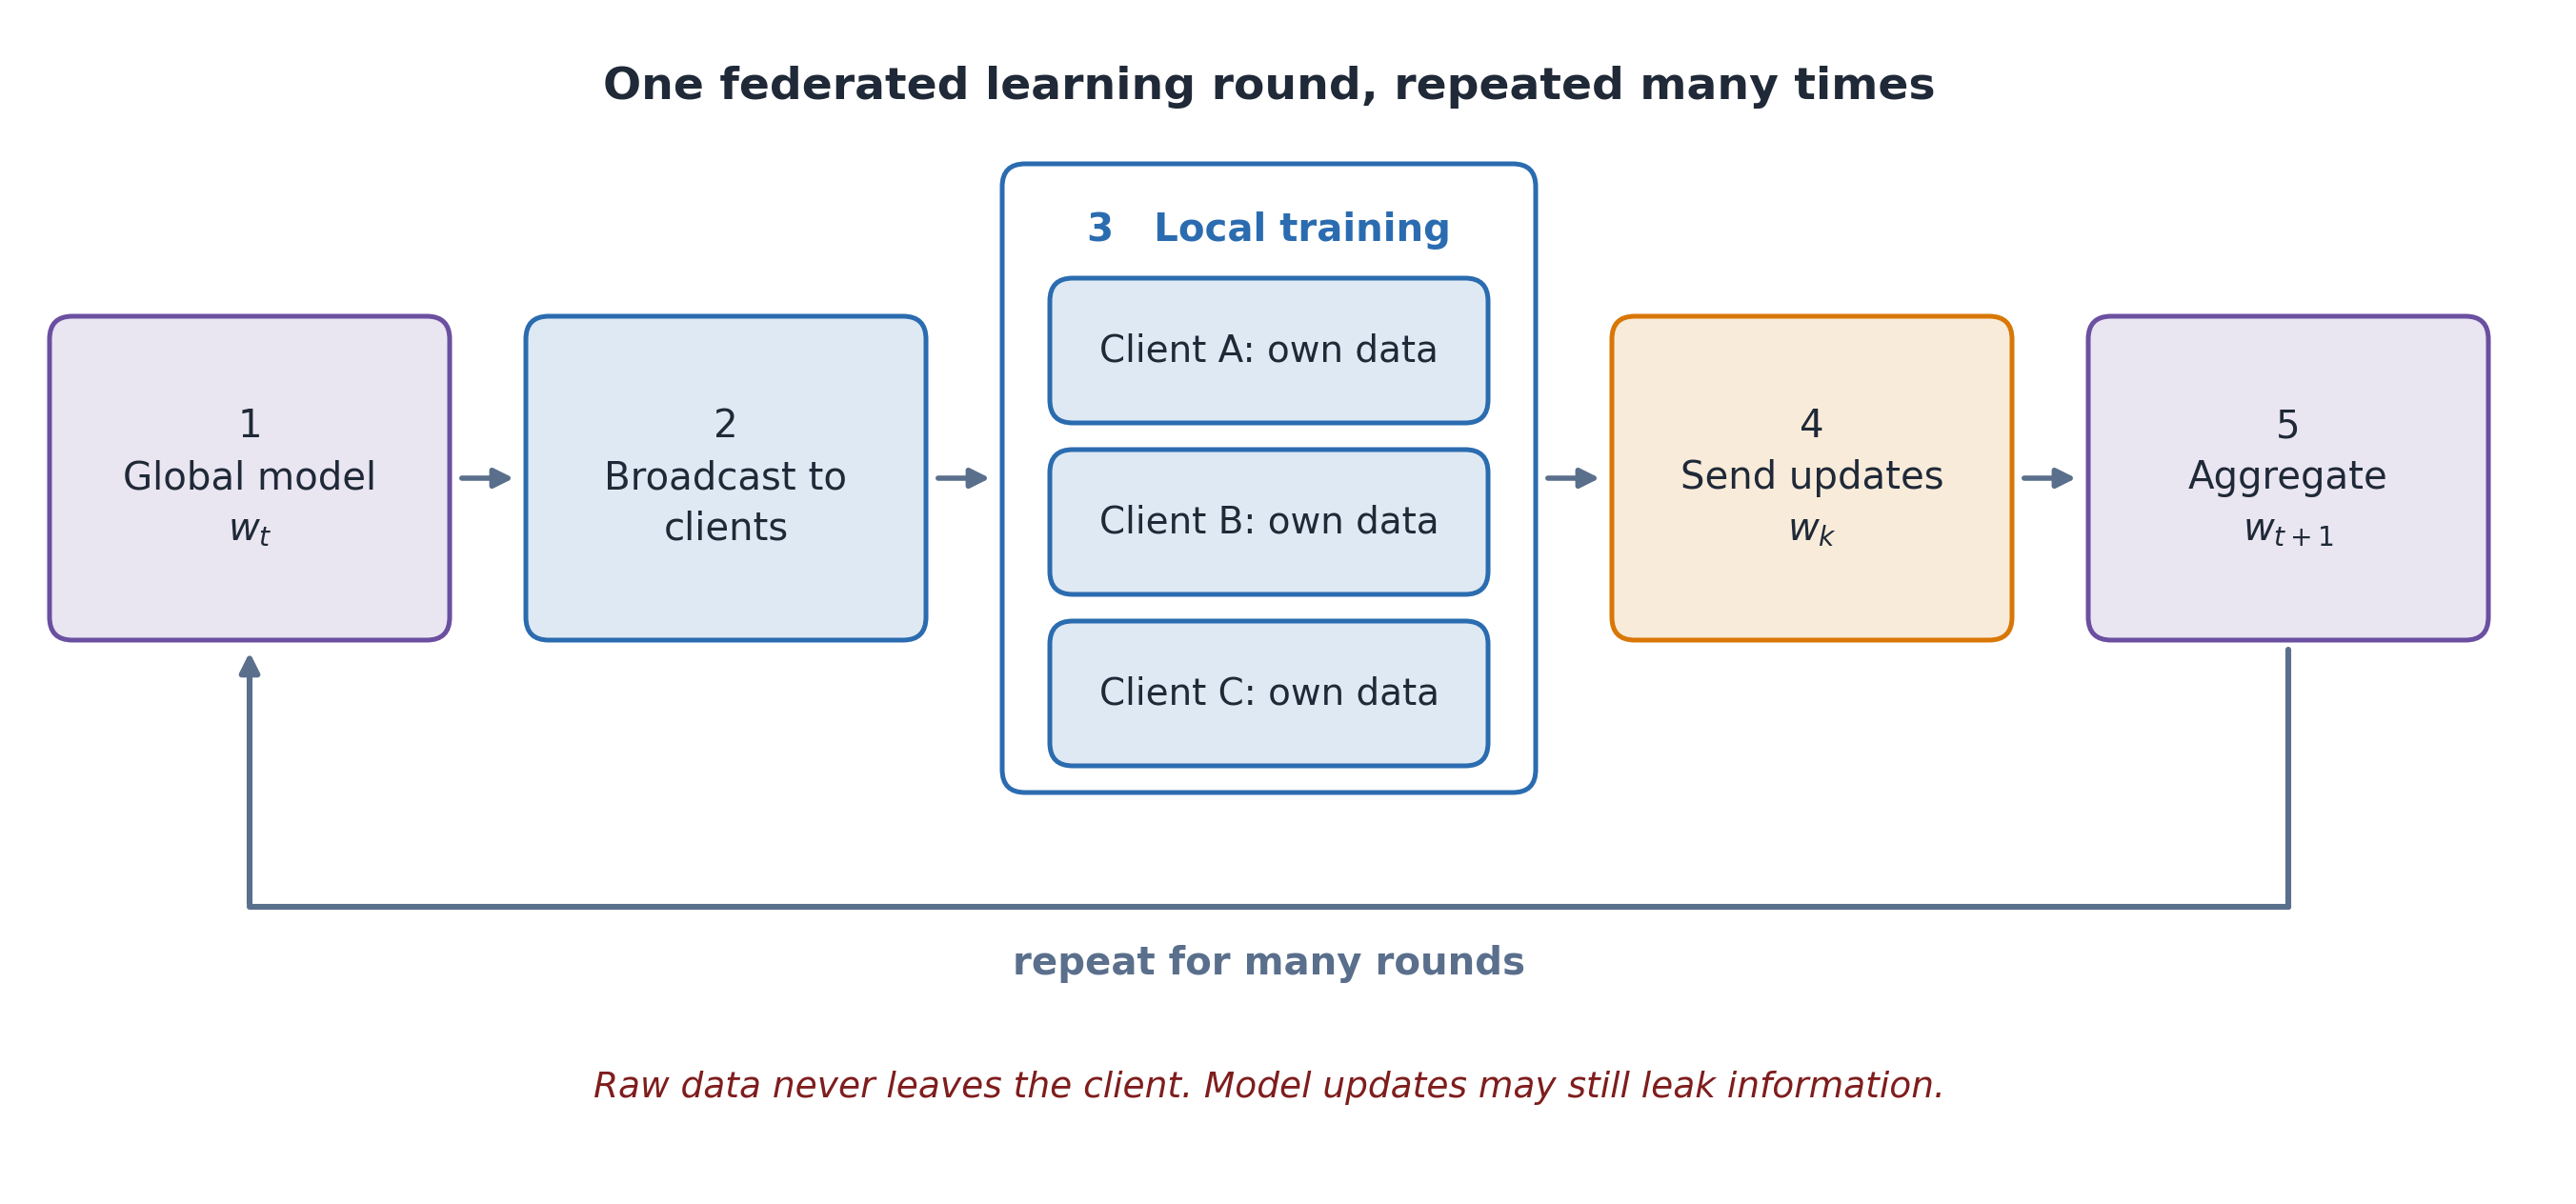
Each participating factory is a client. It trains locally and shares model updates.
IV.C) One Federated Training Round
FIG. One Round of Federated Learning
Send the shared model; each client trains on local data.
Combine what clients learned: the server merges their updates into the next shared model.
Repeat with the next participating clients.
IV.C) FedAvg: A Weighted Average
FedAvg weights client parameters by local example counts 5.
w_k: client k’s parameters after local training; n_k: its example count; N: total examples across participating clients.
A contributes half because it has half the examples. Average corresponding parameters.
IV.C) Centralized vs. Federated Learning
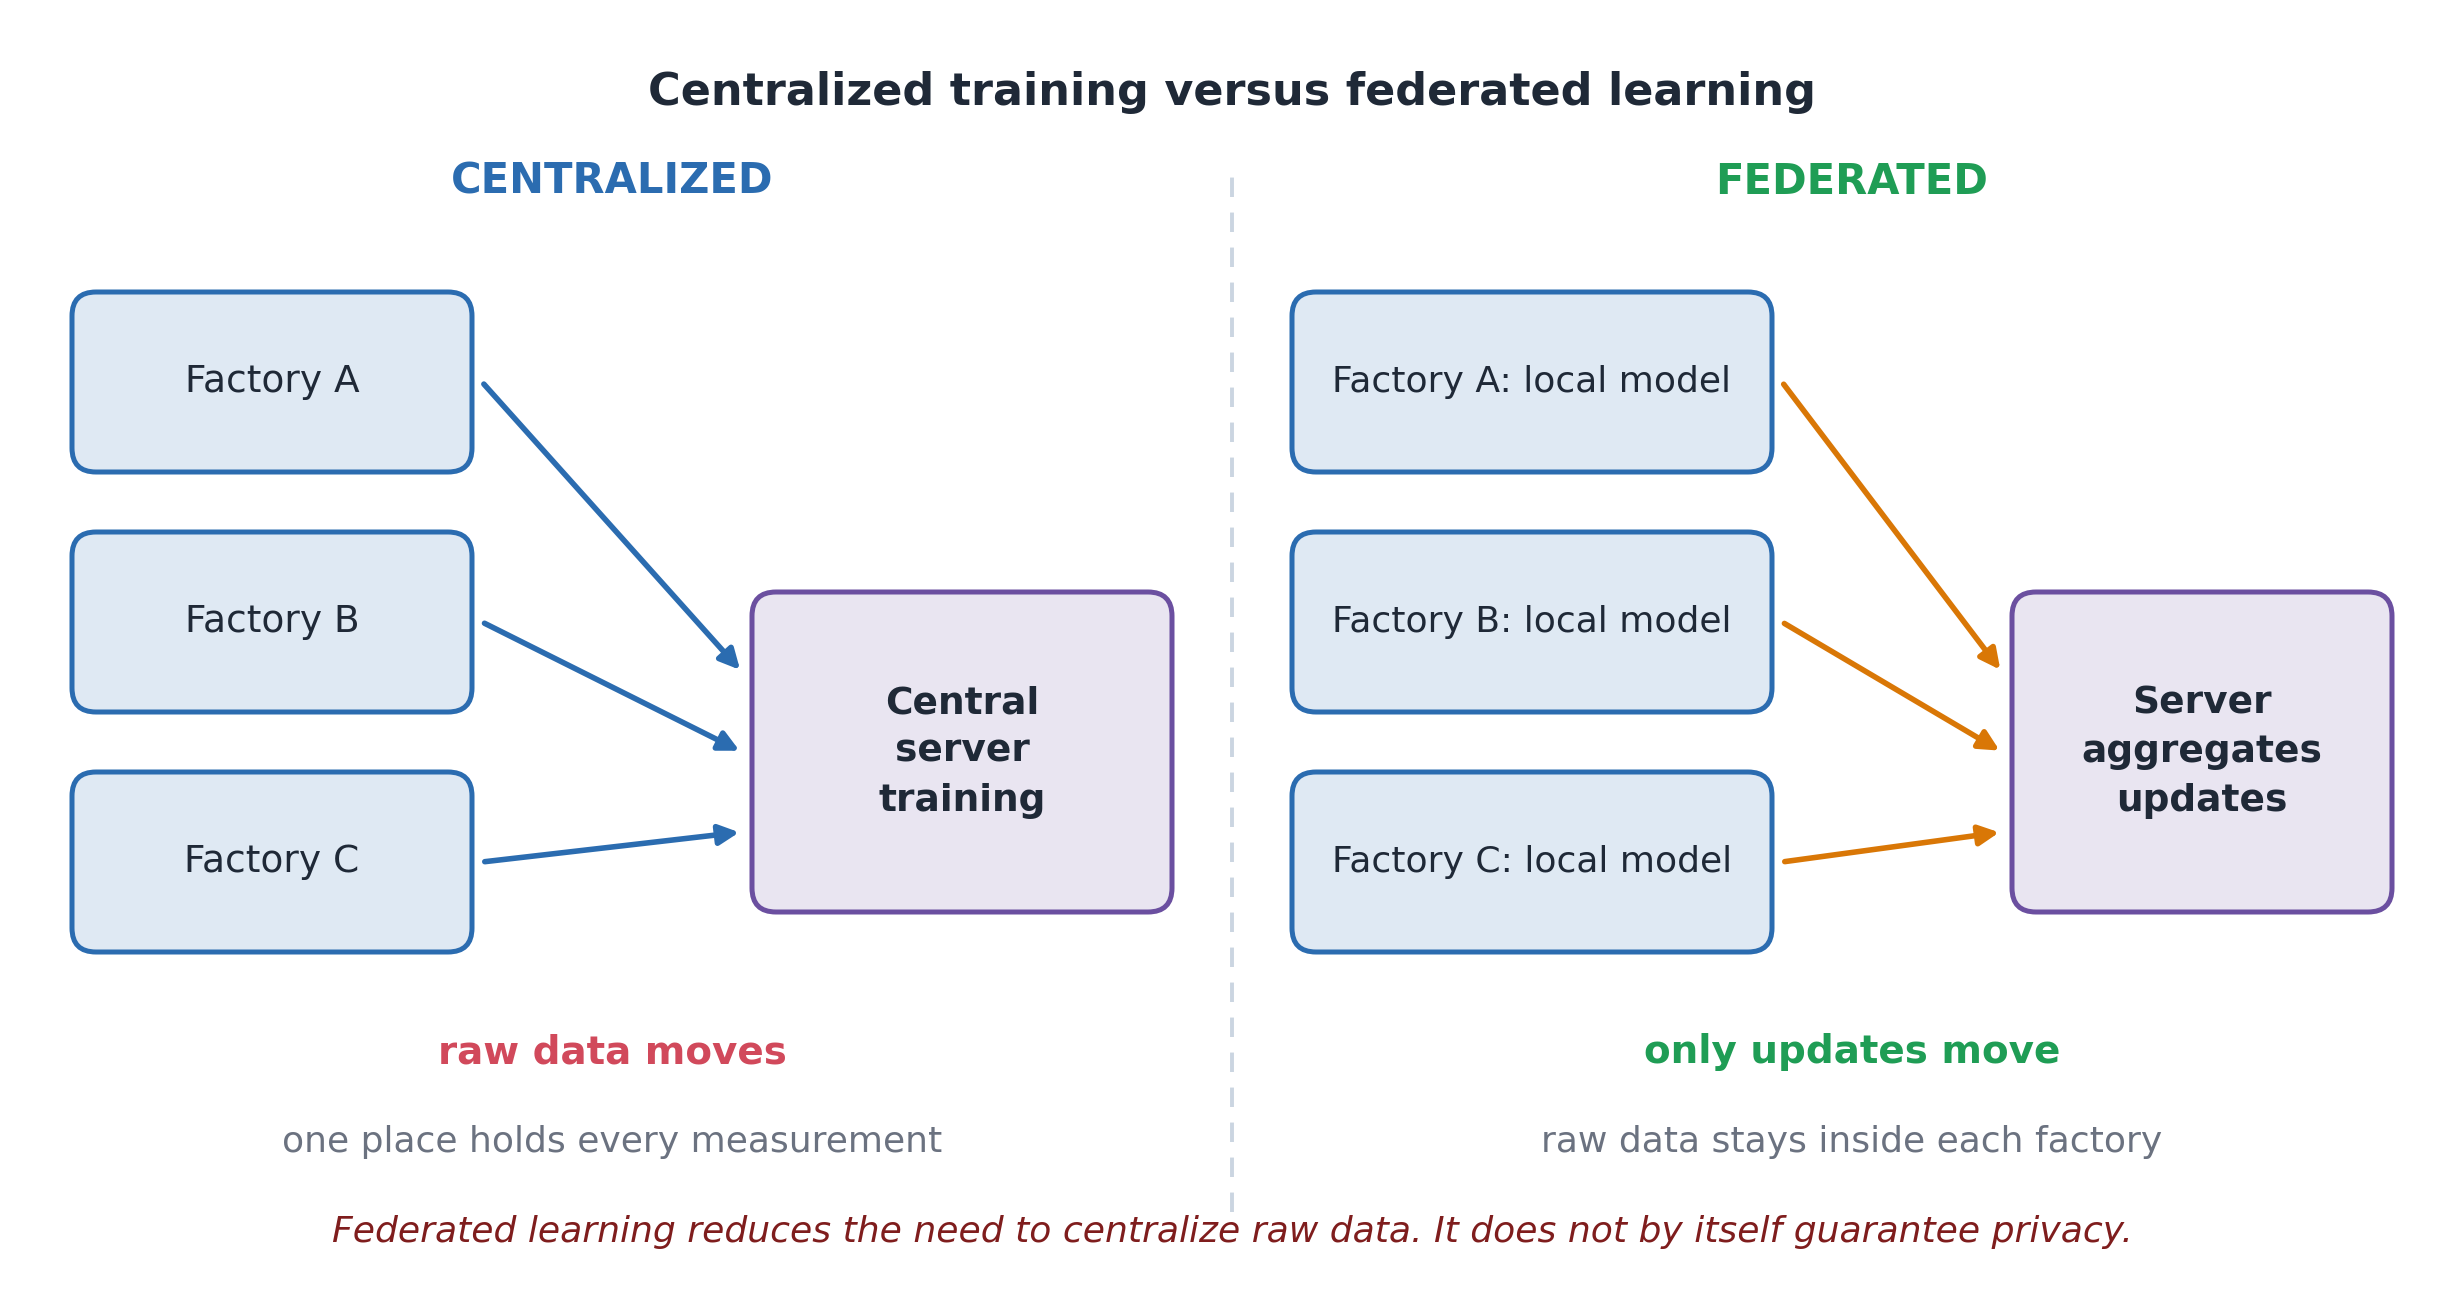
FIG. Centralized Data and Federated Model Updates
Centralized training: data move to the training system.
Federated training: local model updates move between sites and the server.
Keeping raw data local does not guarantee privacy. Updates can reveal information, so extra protection may be needed.
IV.C) Federated Learning: Different Data
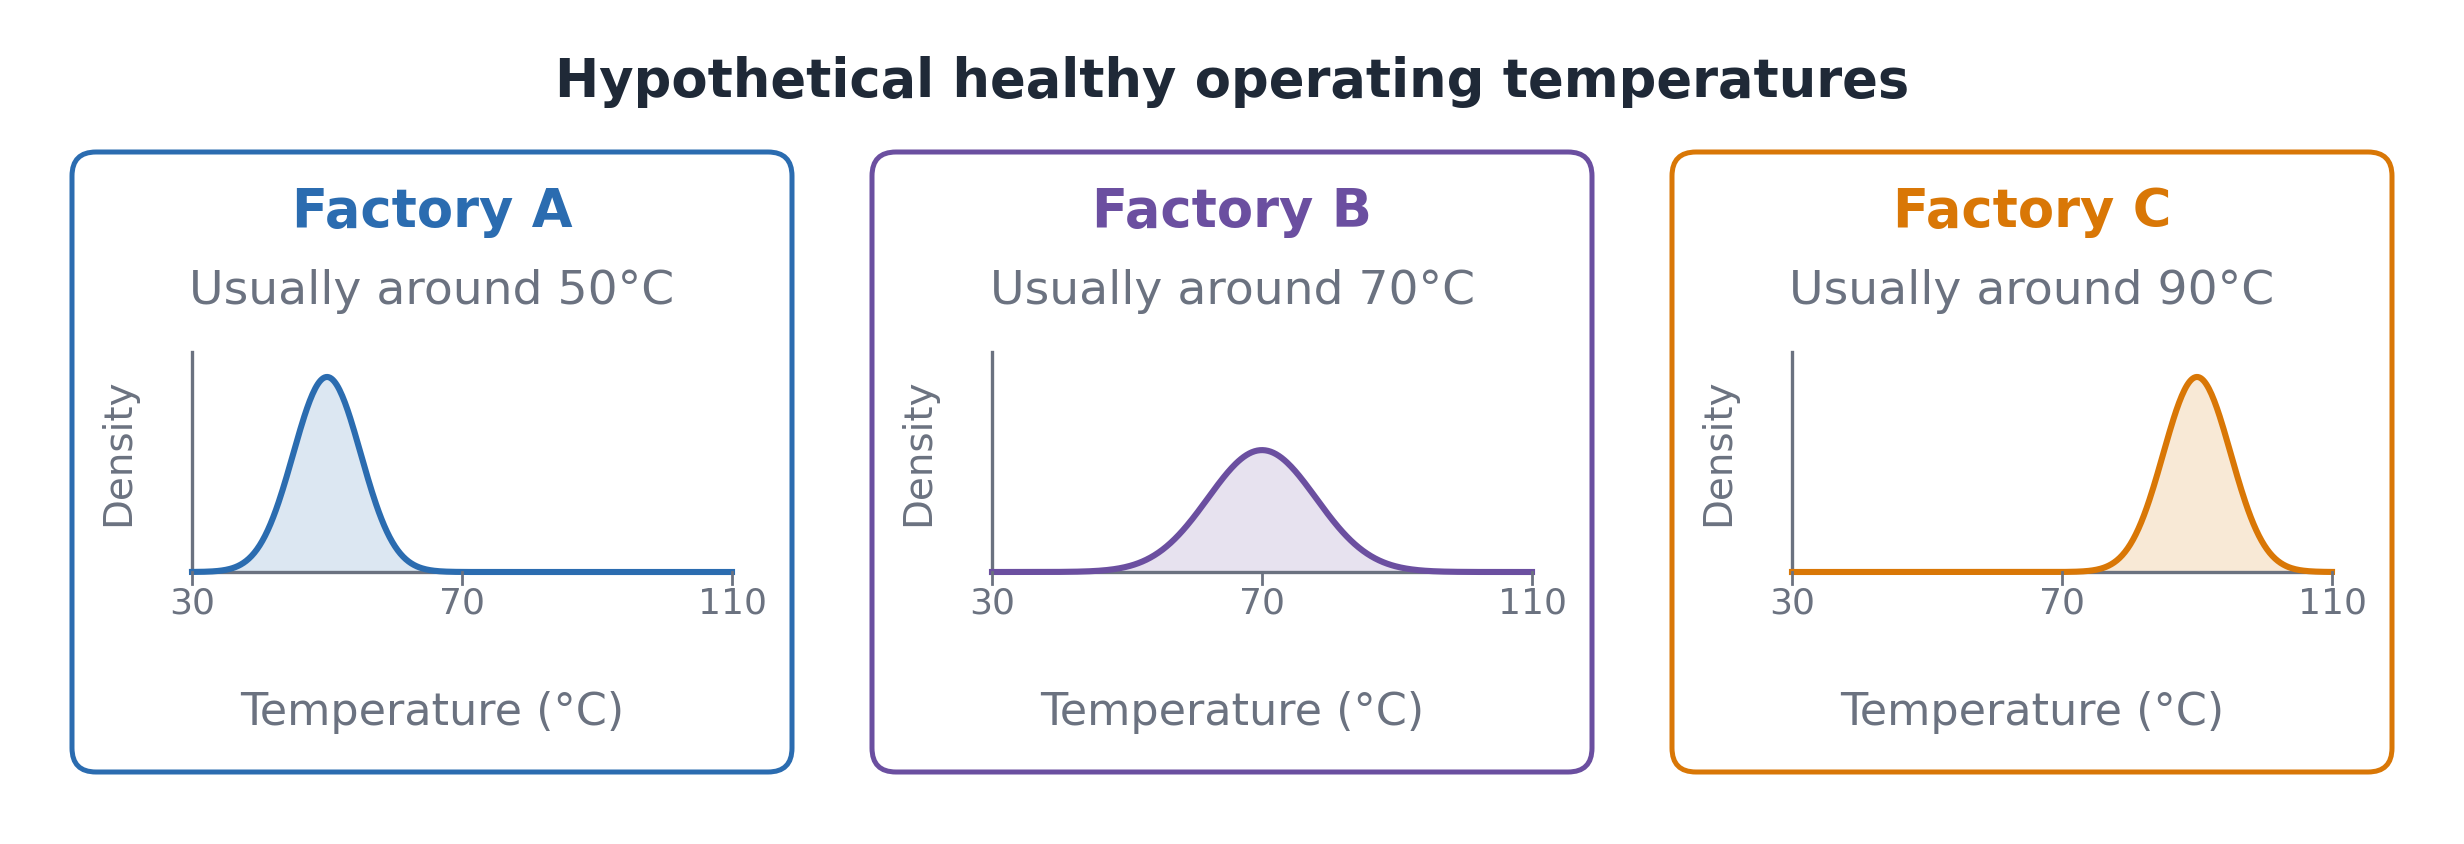
Factories train one shared model, but healthy operating temperatures differ.
FIG. Different Normal Temperatures Across Factories
The risk: a detector could mistake Factory C’s healthy 90°C readings for a fault.
IID means independent and identically distributed. These factories have different distributions, so their data are non-IID.
So, good overall accuracy is not enough. Check the shared model at every factory before using it.
IV.D) Mixture of Experts: Specialization
A ship uses fuel differently when maneuvering, cruising, or operating in heavy weather. These are different operating regimes.
FIG. Different Operating Regimes Motivate Expert Models
If one predictor consistently struggles in some regimes, consider several specialized predictors. First compare with a model that includes the operating conditions as inputs.
IV.D) Mixture of Experts
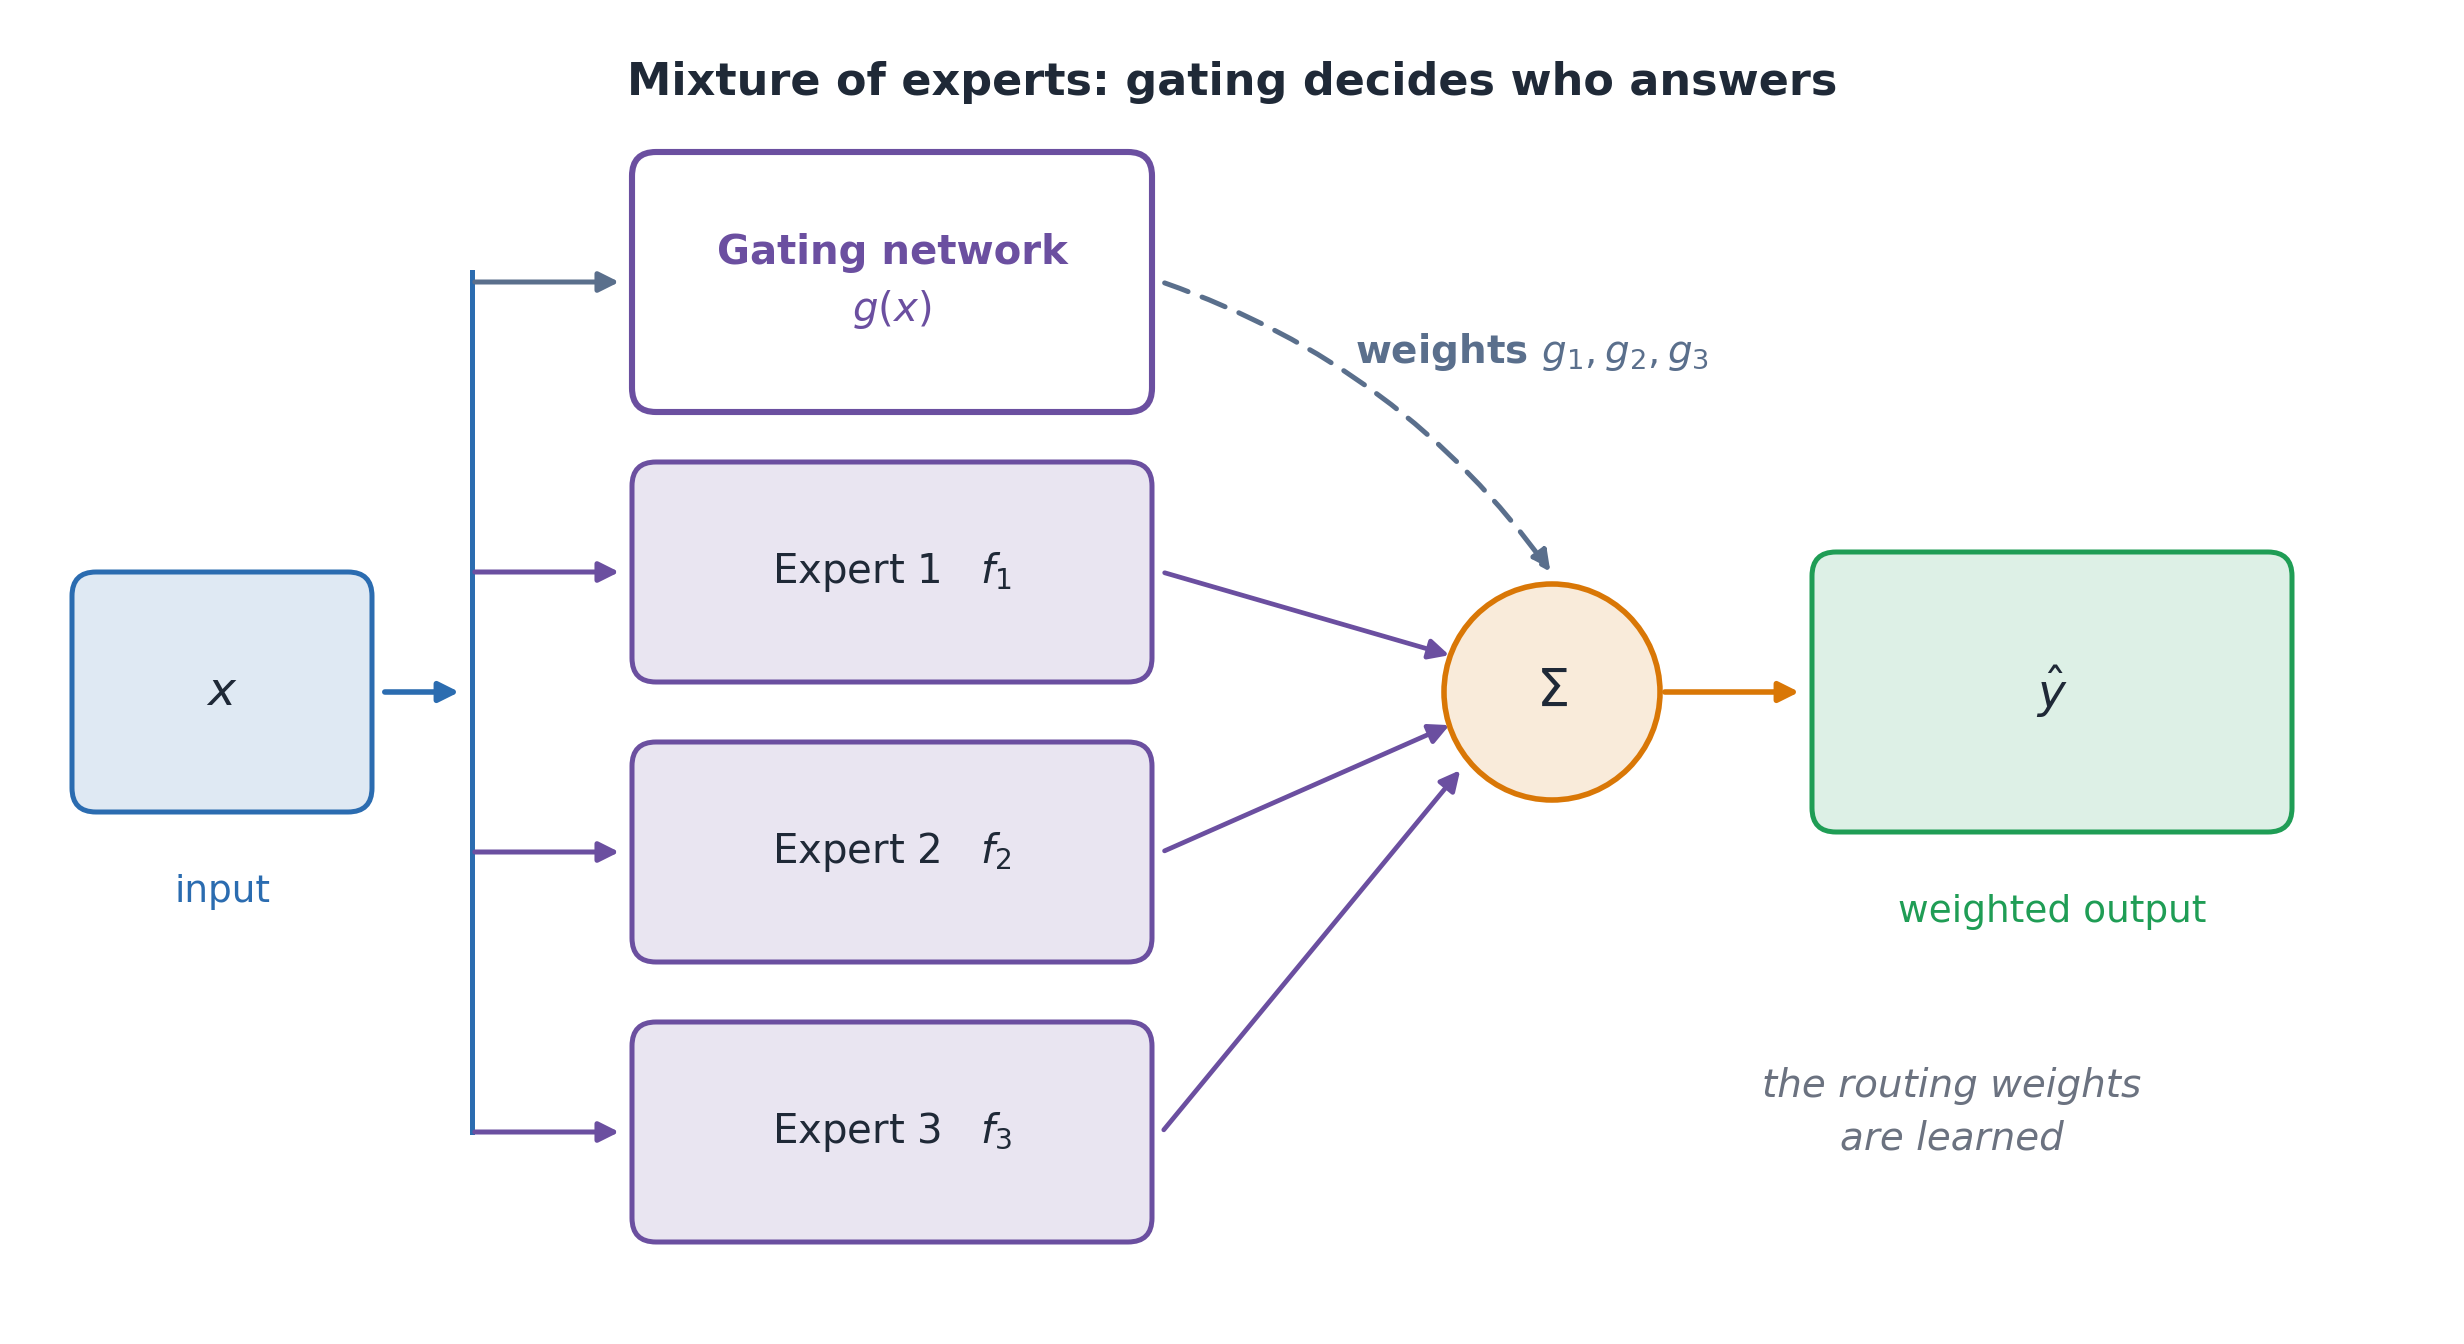
A mixture of experts combines several submodels. A gating network learns to assign their contributions from the input. The gate and experts train together 6.
FIG. Input-Dependent Contributions from Expert Models
f_i(x) is expert i’s prediction. g_i(x) is the weight given to that expert for input x.
The model can rely on different experts for different operating conditions.
IV.D) A Gate Chooses the Expert Contributions
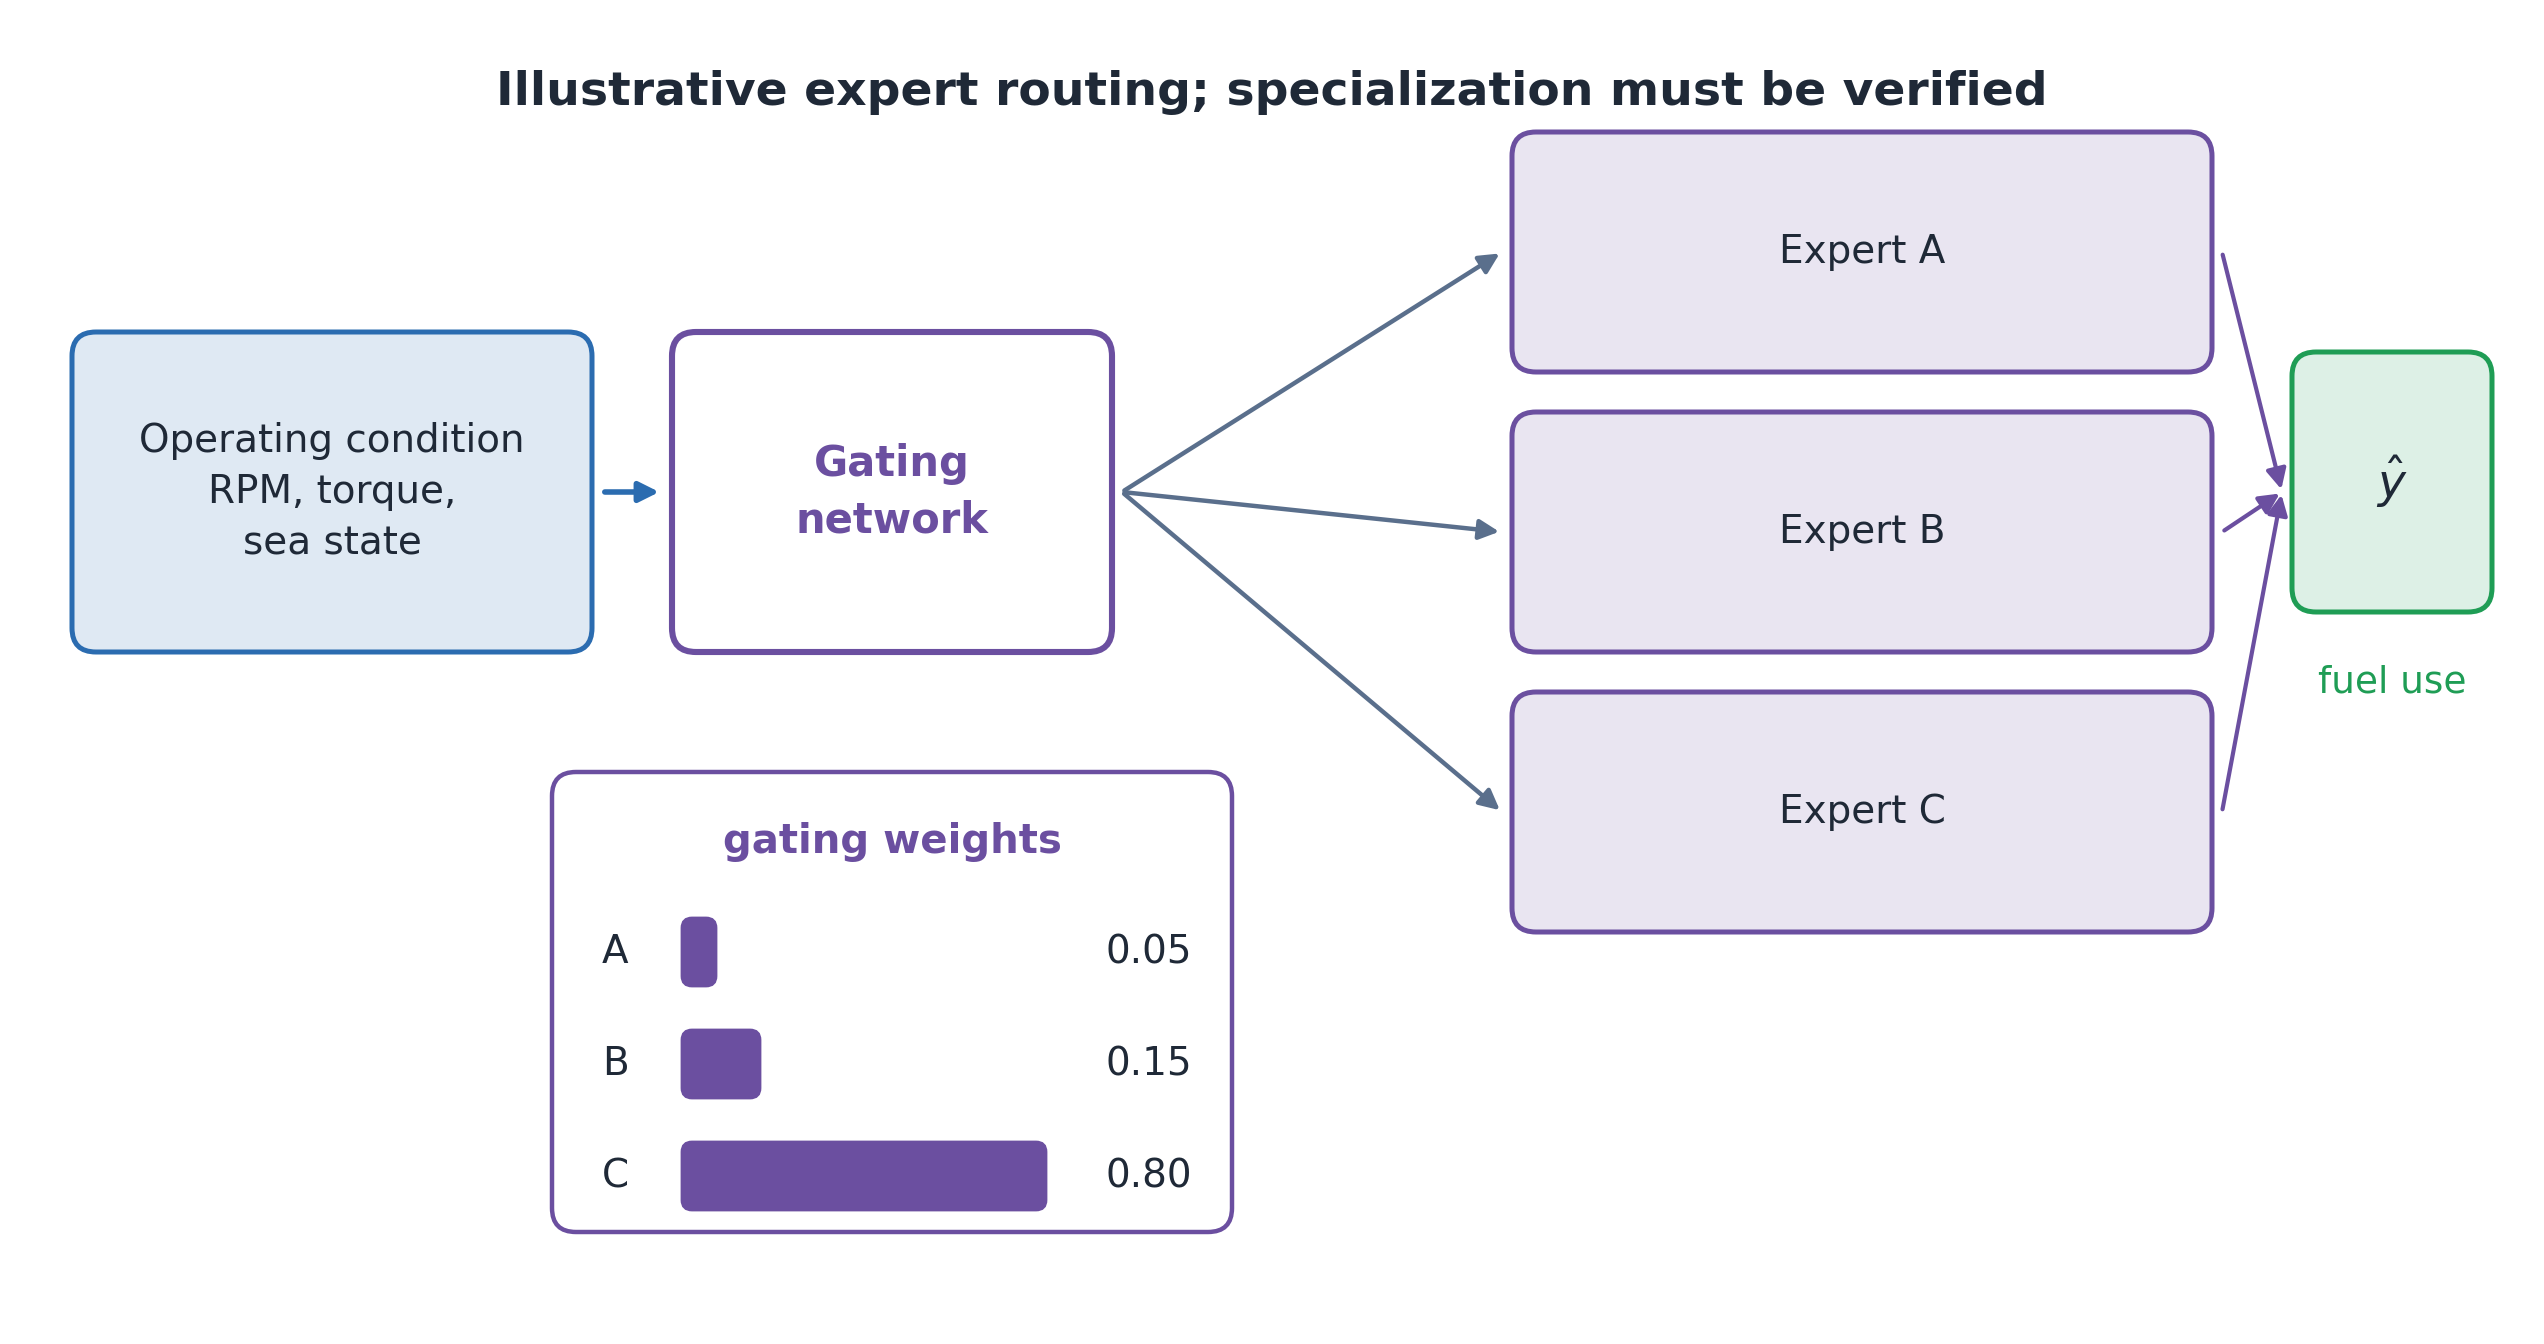
Example input: 18 knots, 0.5 m waves, 75% engine load. The gate selects these illustrative weights:
In general, \hat y=\sum_i g_i(x)f_i(x): f_i(x) is expert i’s prediction; g_i(x) is the gate’s weight for input x.
Expert 1 has the most influence here (80%). The weights are nonnegative, sum to one, and can change with the input.
IV.D) Experts and Conventional Ensembles
Both approaches combine predictions from several models. Their main difference is how the contributions are chosen.
TABLE. Conventional Ensembles and Mixtures of Experts
Averaging/voting ensemble
Mixture of experts
Combine predictions
Average or vote
Use a learned gate
Depend on the input?
Usually the same combination rule
Gate weights depend on the input
Which models run?
Usually all members
All, or a selected subset
A sparse mixture uses only a few experts for each input, reducing computation.
Check whether input-dependent specialization improves predictions enough to justify the extra complexity. Also check that the gate uses its experts effectively.
IV.E) Look Beyond the Network Diagram
A network diagram alone does not tell us how a model is used. Ask:
Task: what does the model need to predict or represent?
Training: what objective does it learn from?
Data: which examples and sites contribute?
Use: how will the result support an engineering decision?
The same type of network can play different roles, depending on these choices.
IV.E) Scope of These Approaches
The lecture covered four groups of modeling choices:
IV.A: learn useful features, including from unlabeled data.
IV.B: share learning across assets or adapt pretrained models.
IV.C: train across sites while keeping raw data local.
IV.D: combine specialized predictors.
Choose approaches for the needs they address; combine them when useful. These groups are not a complete list of AI methods.
IV.E) Choosing an Approach
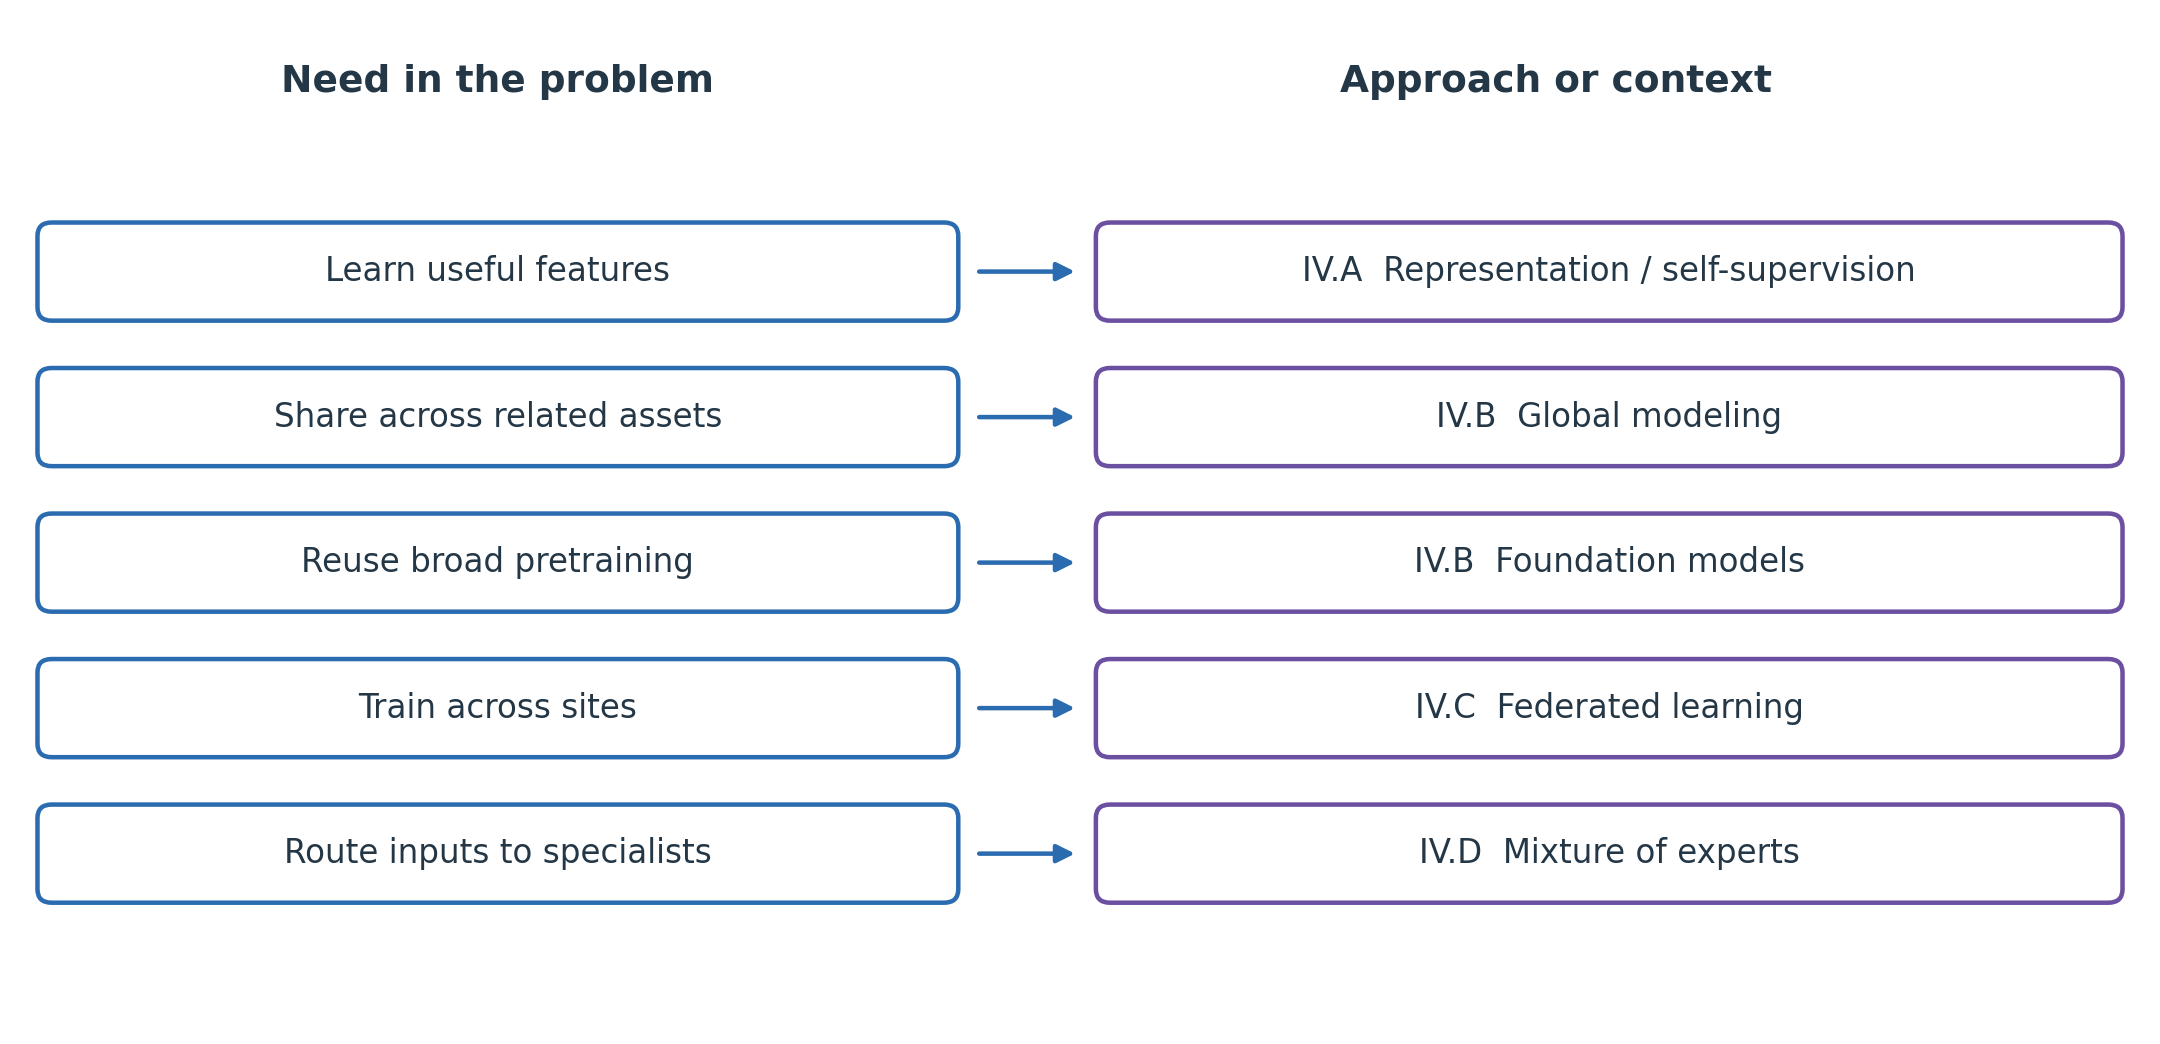
FIG. Problem Questions Suggest Candidate Approaches
This is a guide, not an exclusive decision tree. Several approaches may be combined; compare choices with a suitable baseline.
IV.E) Comparing the Approaches
TABLE. Learning, Sharing, and Combining Models
Approach or context
When to consider it
Main idea
What to check
Self-supervised features
Few task labels
Learn from targets created from the inputs
Do the features help the final task?
Global model
Many related assets
Share learning across assets
Performance on each asset
Foundation model
Several tasks to adapt to
Reuse a broadly pretrained model
Fit to the new data and task
Federated learning
Data stay at different sites
Train locally and combine updates
Local performance, privacy, communication
Mixture of experts
Different operating conditions
Learn how to combine specialized models
Accuracy, cost, use of each expert
Ask what is learned, shared, or reused. These choices describe different parts of a learning system.
IV.E) Which Approach Would You Choose?
For each situation, suggest an approach and explain why it may help. More than one answer may be reasonable.
A. Ten years of vibration data, but only 40 confirmed bearing failures.
B. Five companies with similar machines cannot share raw production data.
C. A ship’s fuel use differs during maneuvering, cruising, and heavy weather.
IV.E) Read the Method, Not Just Its Name
A paper describes its model as an industrial foundation model. Before accepting that description, ask:
What are the inputs and outputs?
What data were used for pretraining, and how broad are they?
What loss or objective is used for training?
How much adaptation does each new task require?
Does the method improve on a suitable baseline on unseen cases?
Judge the method by what it does and how it is evaluated.