We will mainly use machine temperature and RPM, with other sensors where useful. Week 6 applies these ideas in a practical session. Full explanations, worked answers, and a glossary are in the lecture notes on the Week 4 page.
I.A) Understanding Time-Series DataReading a Time-Series Graph
A time series is a sequence of observations recorded over time.
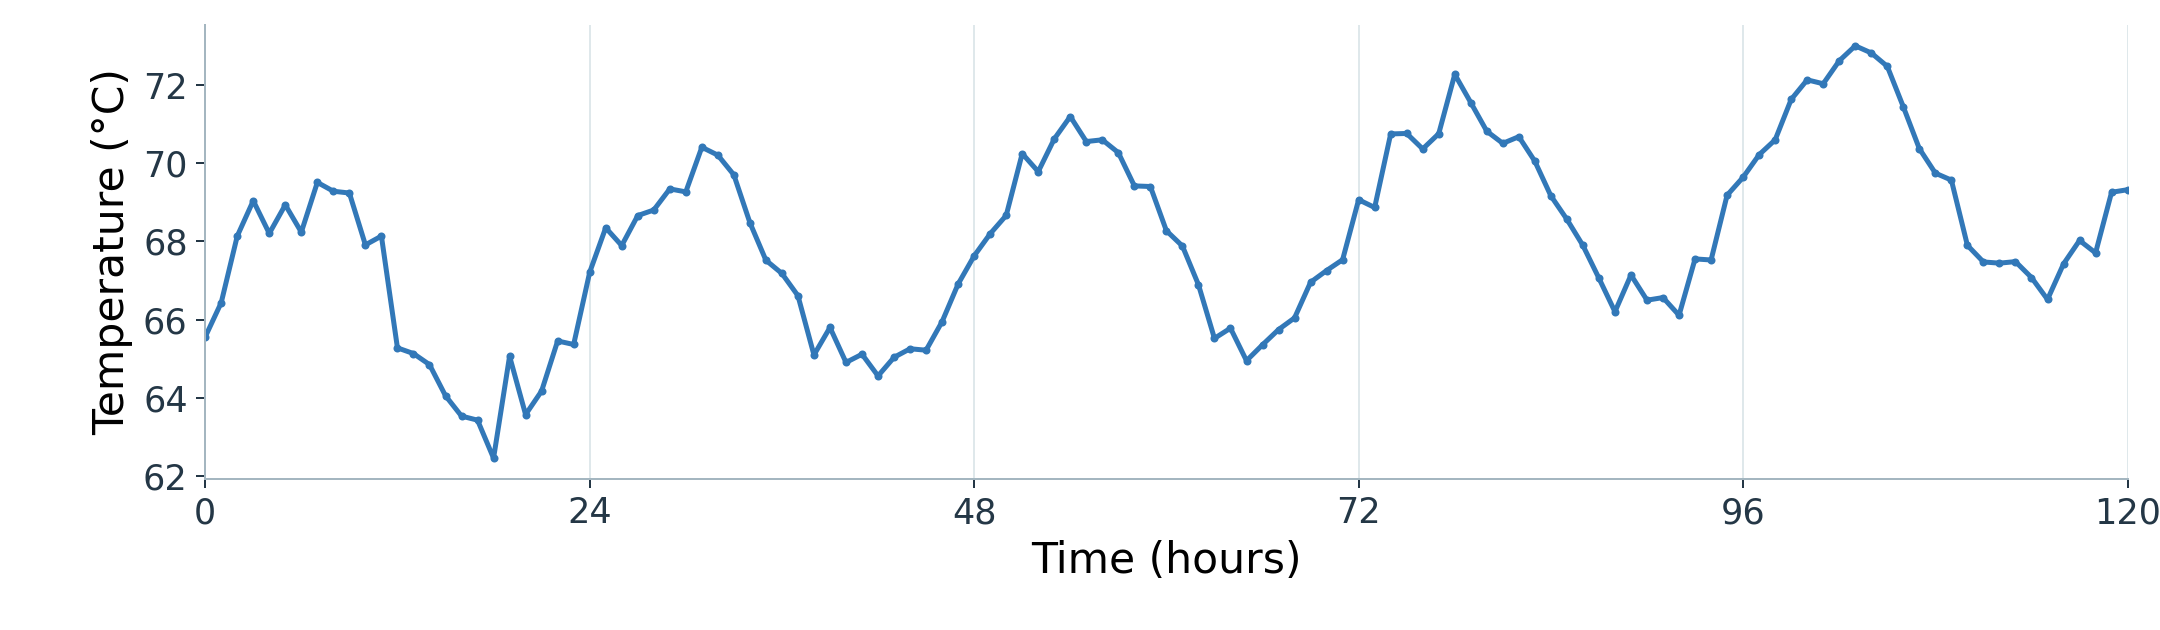
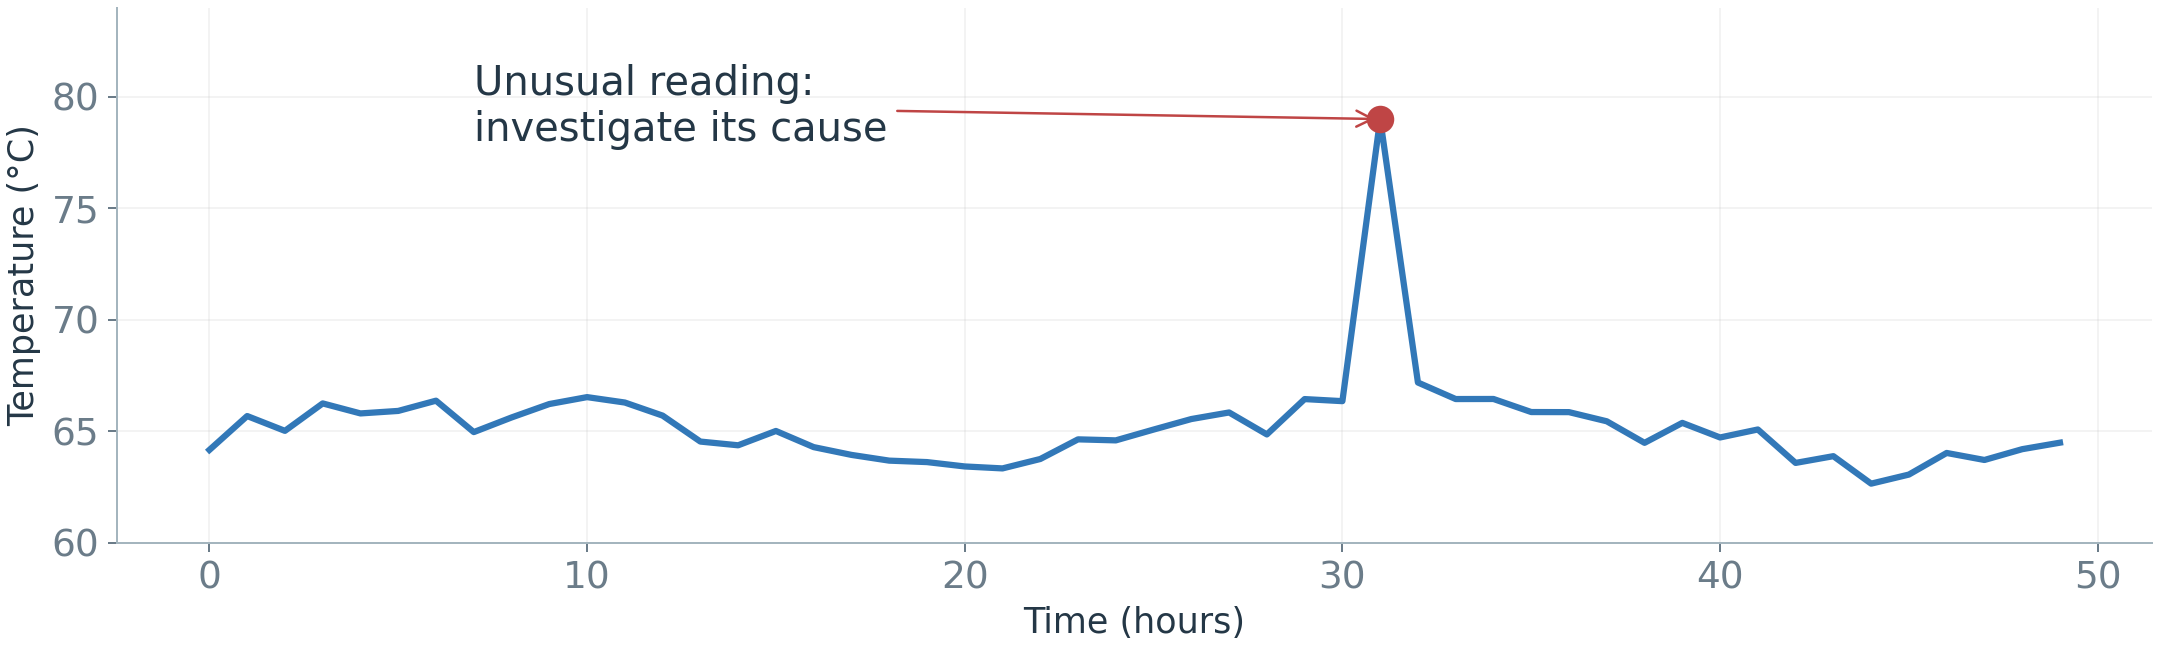
Here, each point is an hourly machine-temperature reading. Time is on the horizontal axis; temperature is on the vertical axis.
Figure 2. Hourly temperature readings from one machine, using illustrative data.
What can you see? An overall rise, repeating peaks, and smaller irregular changes. We will separate these patterns next.
I.A) Understanding Time-Series DataDecomposition: Why Separate the Patterns?
Time-series decomposition separates an observed series into estimated components. For an observed value y_t at time t, an additive decomposition is:
y_t=T_t+S_t+R_t
Trend (T_t): the underlying level and longer-term direction.
Seasonality (S_t): variation that repeats at a regular interval, such as each day.
Remainder (R_t): what remains after removing the estimated trend and seasonality.
Why use it? Separate long-term change from repeated variation, then examine what remains.
I.A) Understanding Time-Series DataDecomposition: Reading the Components
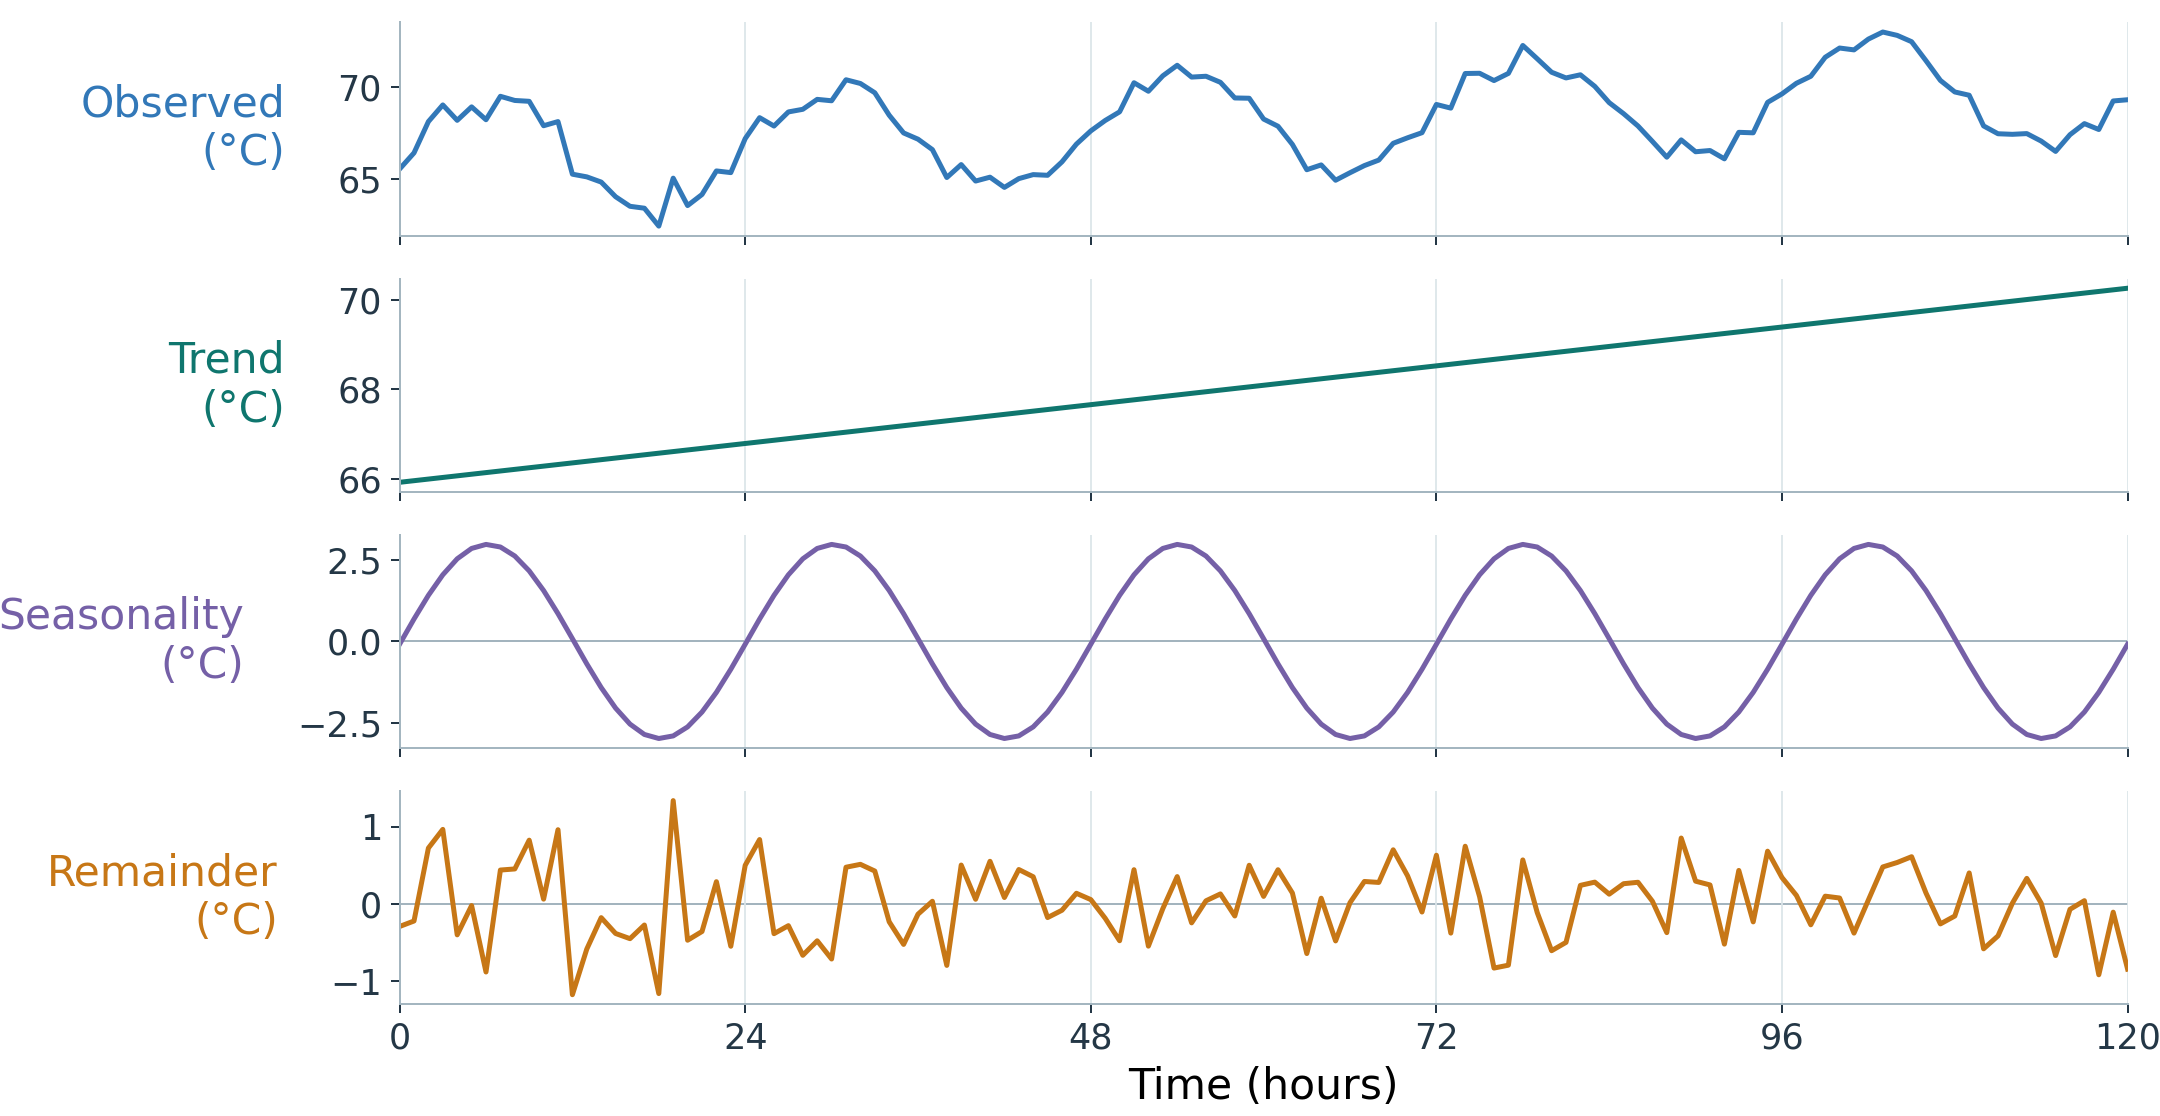
This is the same temperature series, now split into its three parts. All panels share the same time axis.
Figure 3. Additive decomposition of the temperature series from the earlier graph.
The remainder is not just noise: it can also hide unusual events, or patterns the split missed.
I.A) Understanding Time-Series DataLags: How Past Readings Help Forecasting
Machine temperature often changes gradually, so a recent reading can help predict the next one. A relationship between readings at different times is called temporal dependence.
A lag tells us how far back a reading is from the value we want to predict.
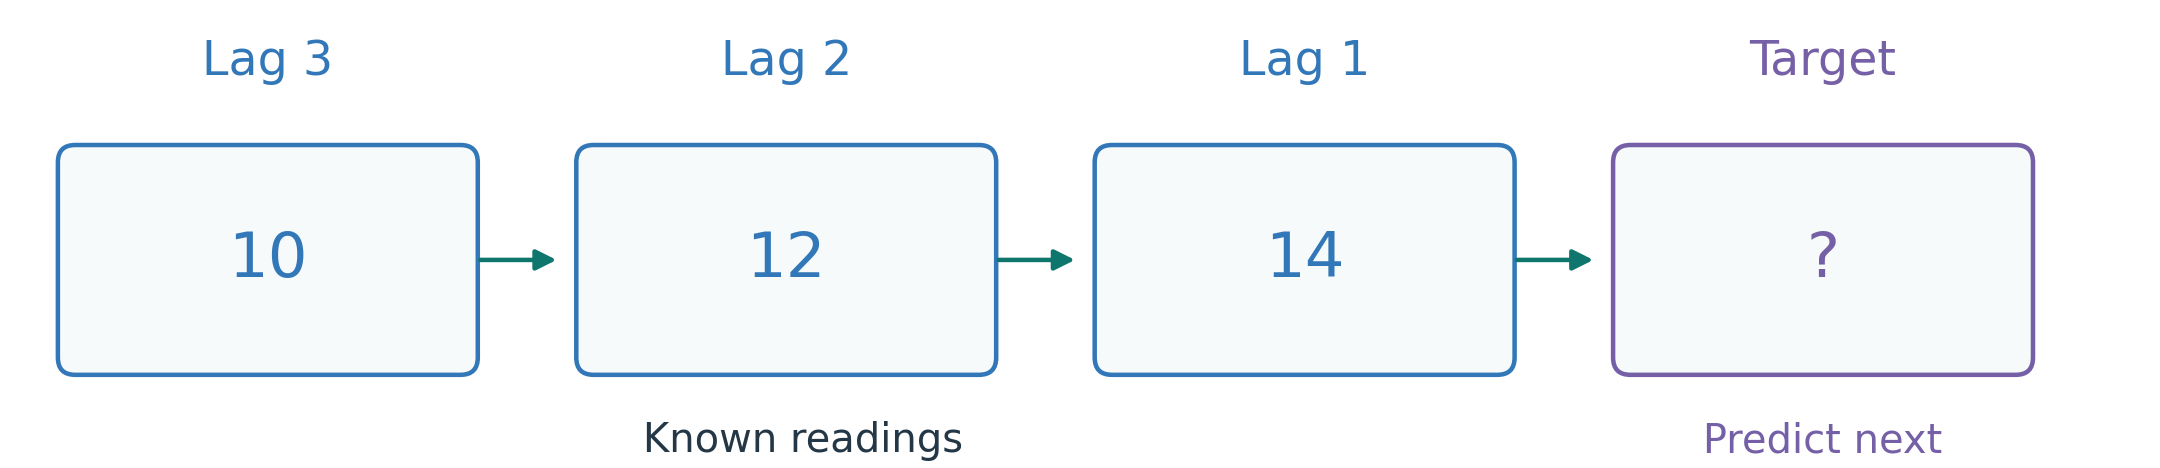
Predict the next reading from 10, 12, 14: lag 1 is 14; lag 2 is 12; lag 3 is 10.
Figure 4. Count lags back from the value being predicted.
Quick question: once 17 arrives, what are lags 1 and 2 when predicting the next reading?
I.B) Defining the ForecastChoosing the Lookback Window and Forecast Horizon
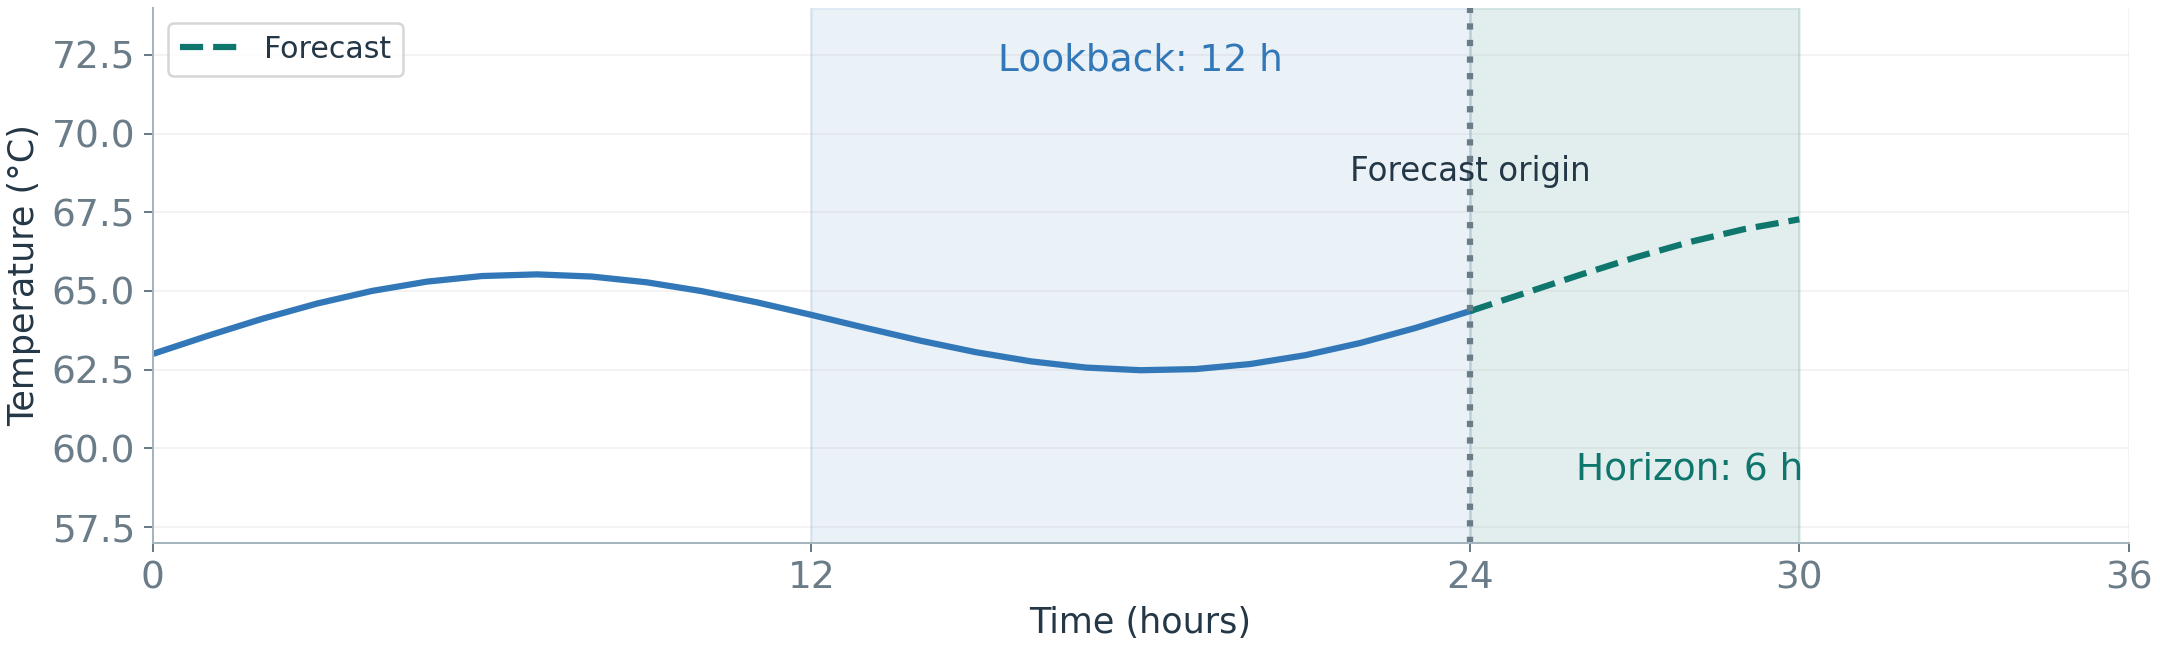
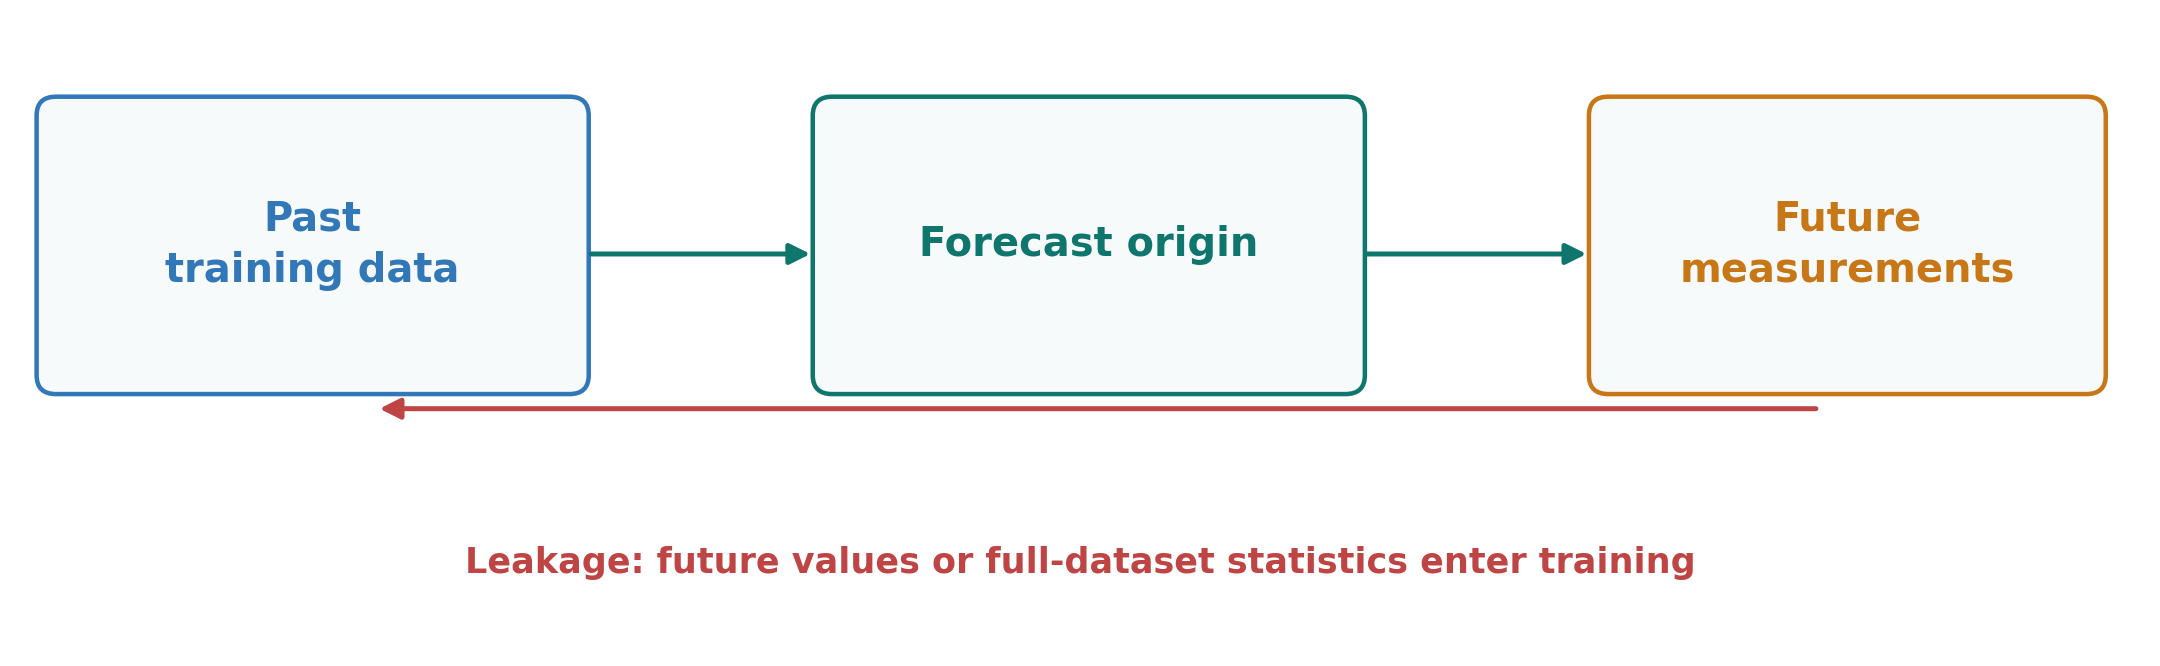
Forecasting uses information available now to estimate future observations. The forecast origin is the moment the forecast is made.
Lookback window: the history supplied to the model.
Forecast horizon: how far ahead we predict.
Example: use the previous 12 hours to predict the next 6 hours of machine temperature.
Figure 5. History ends at the forecast origin.
I.B) Defining the ForecastChoosing the Variables and Prediction Steps
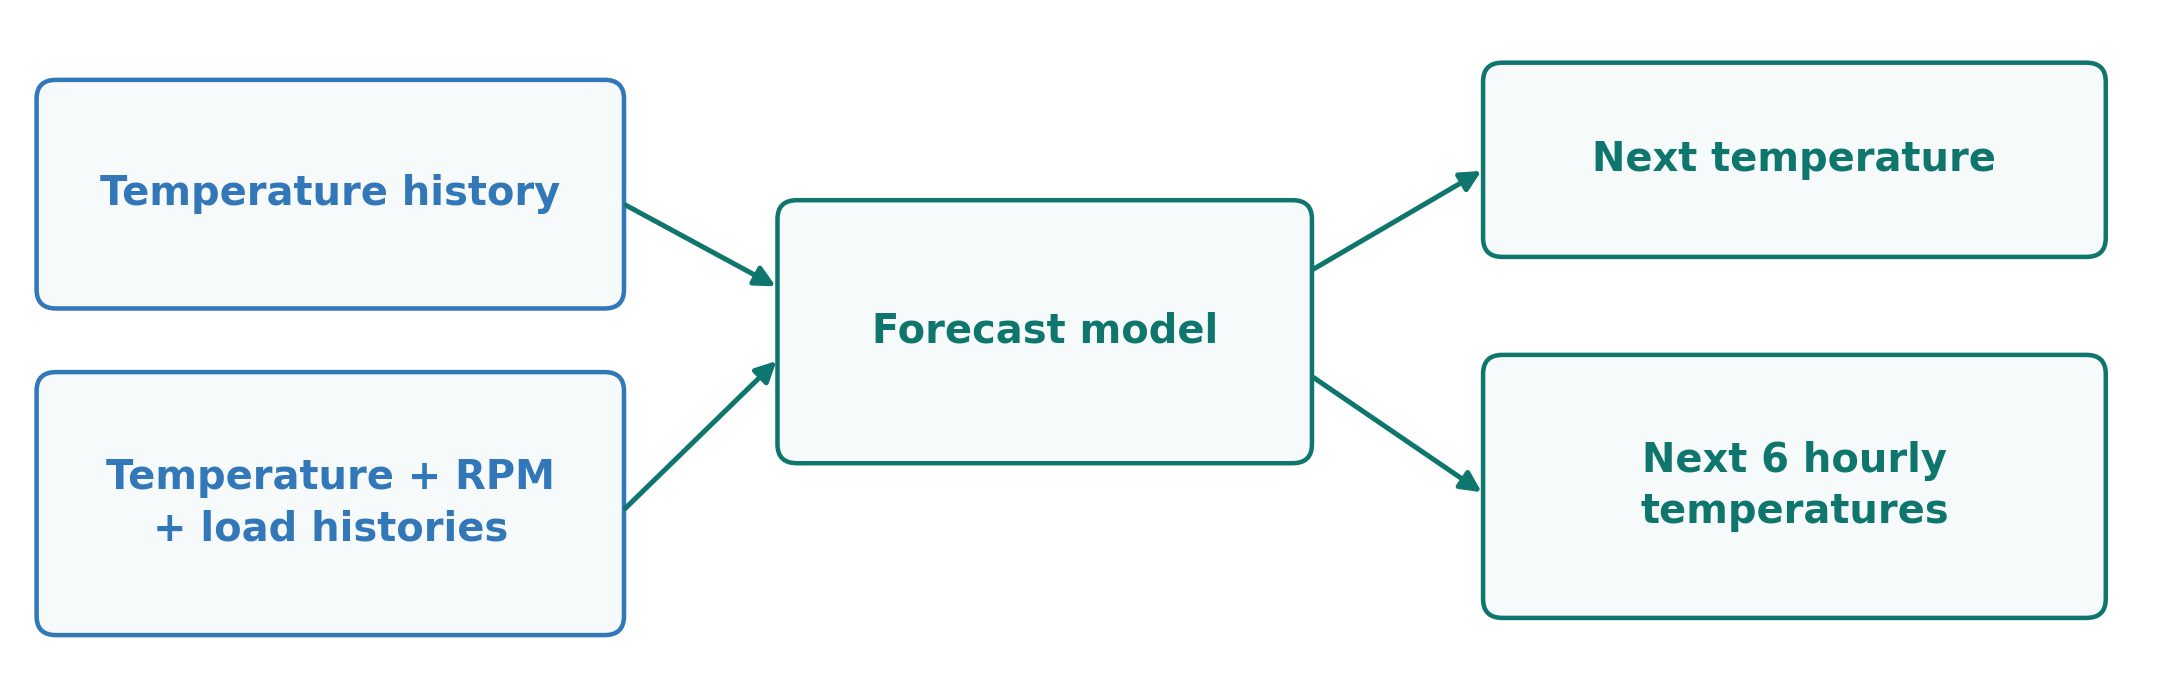
Univariate: forecast a variable from its own history.
With covariates: add related inputs, such as past RPM or a known future load schedule.
Joint multivariate forecasting: forecast several related variables together.
One-step / multi-step means one future reading / several. Reusing predictions as future inputs can accumulate error.
Figure 6. Input choice and forecast horizon are separate decisions.
I.C) Forecasting MethodsHow a Model Learns to Forecast
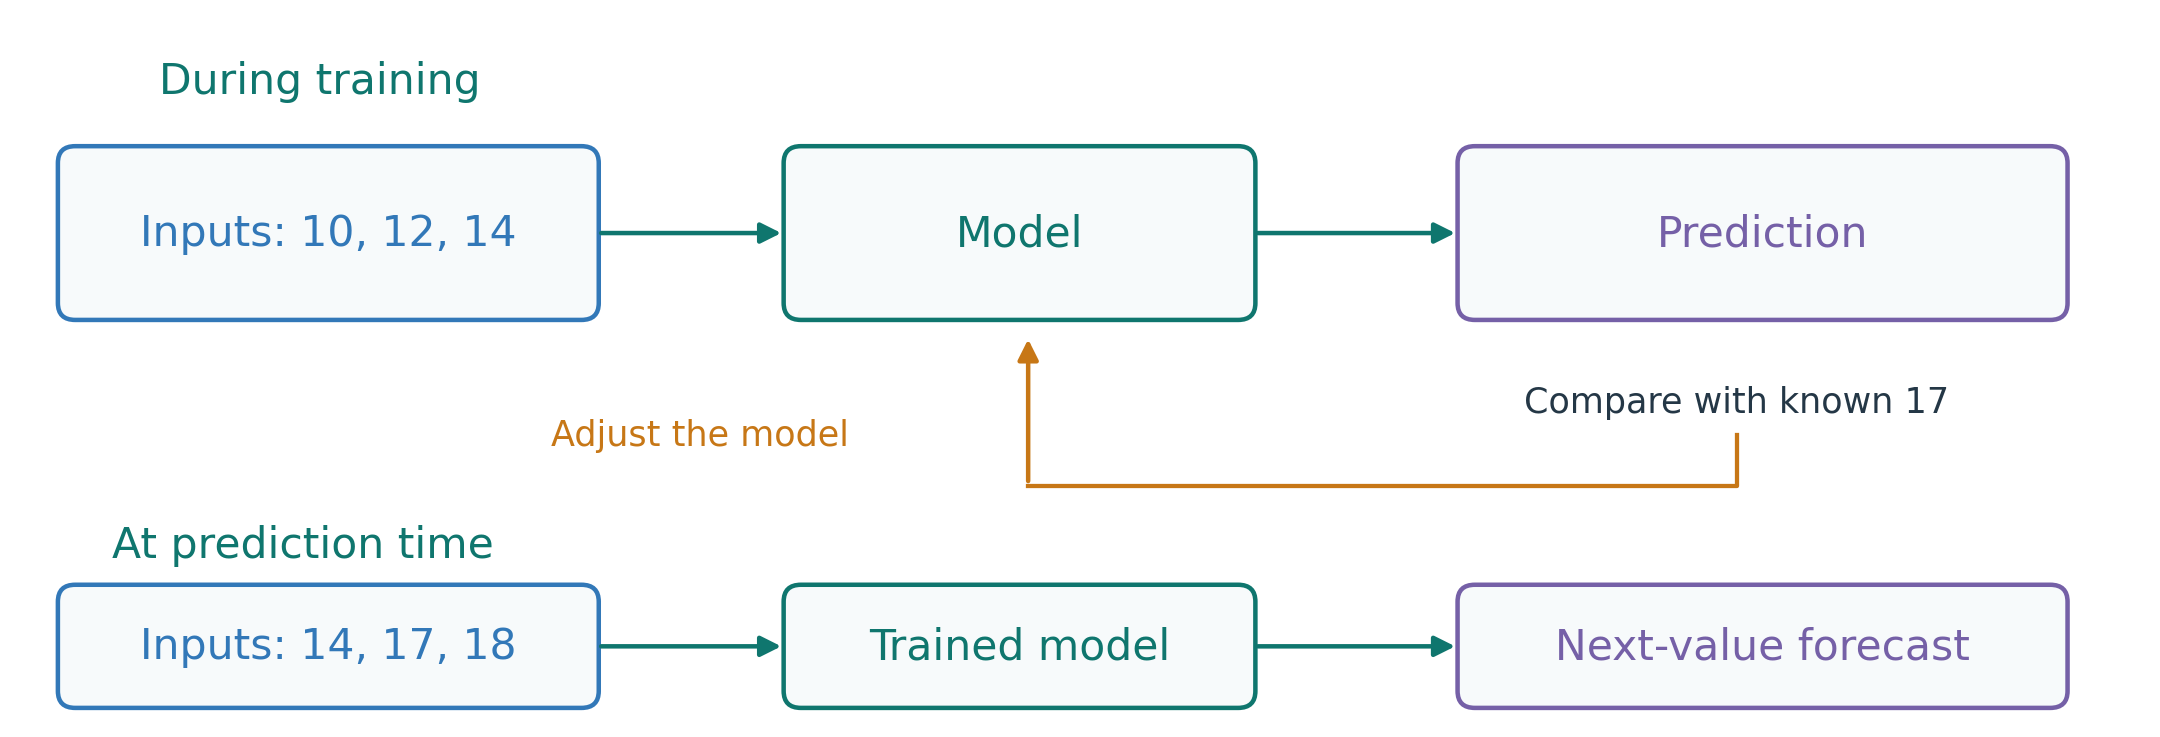
A model is a rule or learned relationship that turns inputs into a prediction.
Inputs, or features: information we provide, such as three past readings.
Target: the next reading we want to predict.
Training: use past examples with known targets to adjust the model.
Prediction: apply the trained model when the next target is still unknown.
Figure 7. Training uses known outcomes; forecasting estimates an unknown outcome.
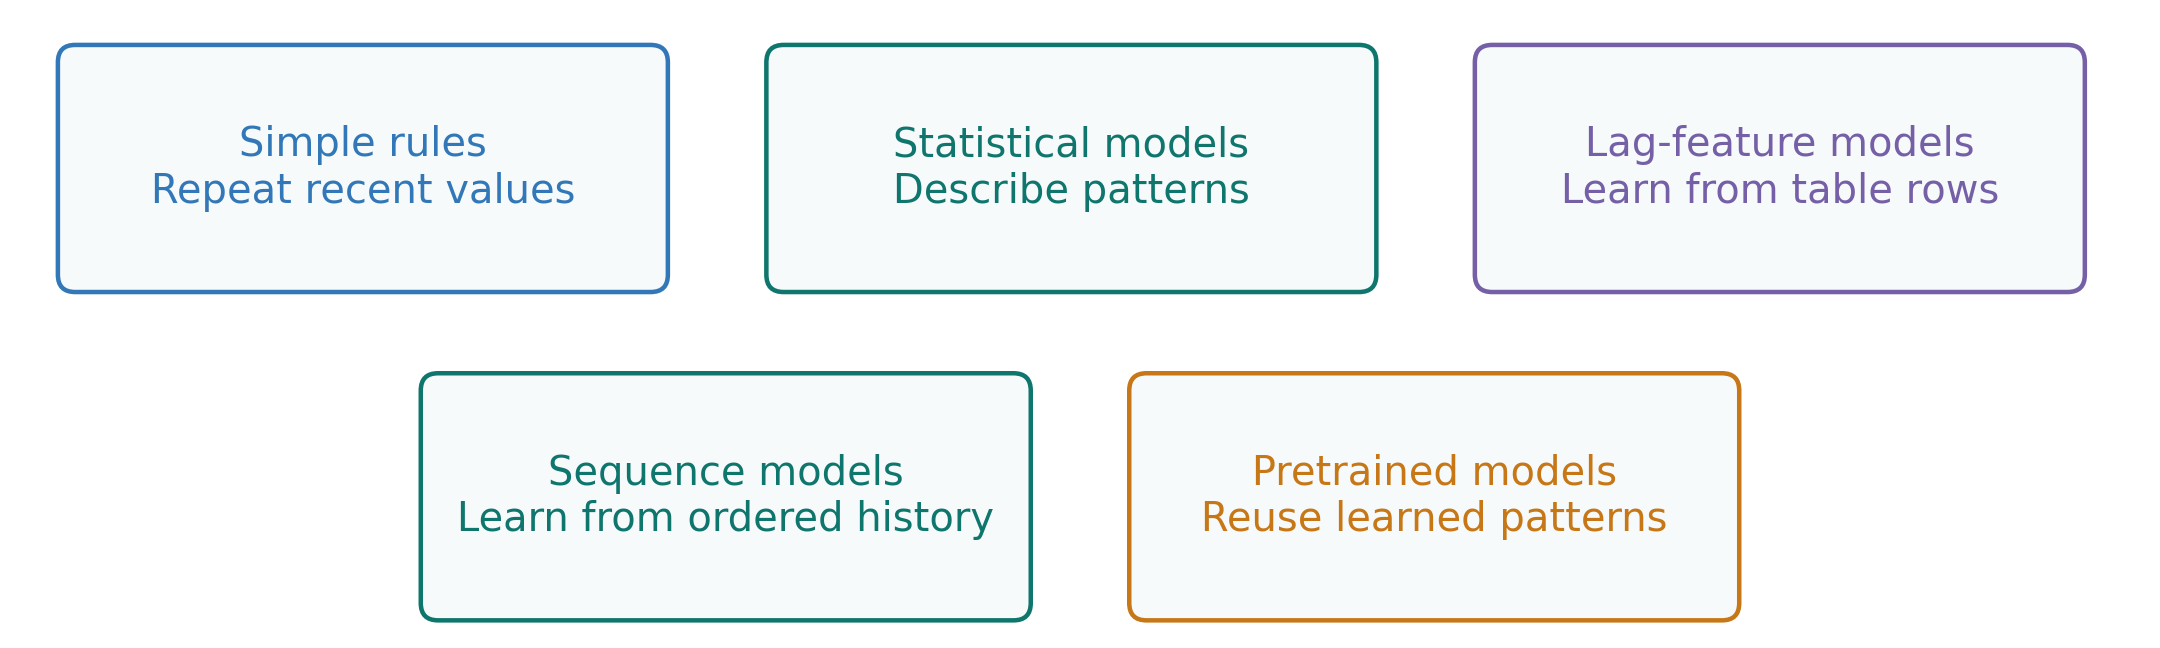
We can forecast the same target in several ways. The difference is how each approach uses history.
A baseline is a simple method used for comparison. Start there, then test whether a more complex method improves the forecast.
Figure 8. Alternative forecasting approaches, not steps in a required pipeline.
For each approach, ask: what history does it use, and does it beat the baseline?
I.C) Forecasting MethodsNaive Forecasts: Setting a Baseline
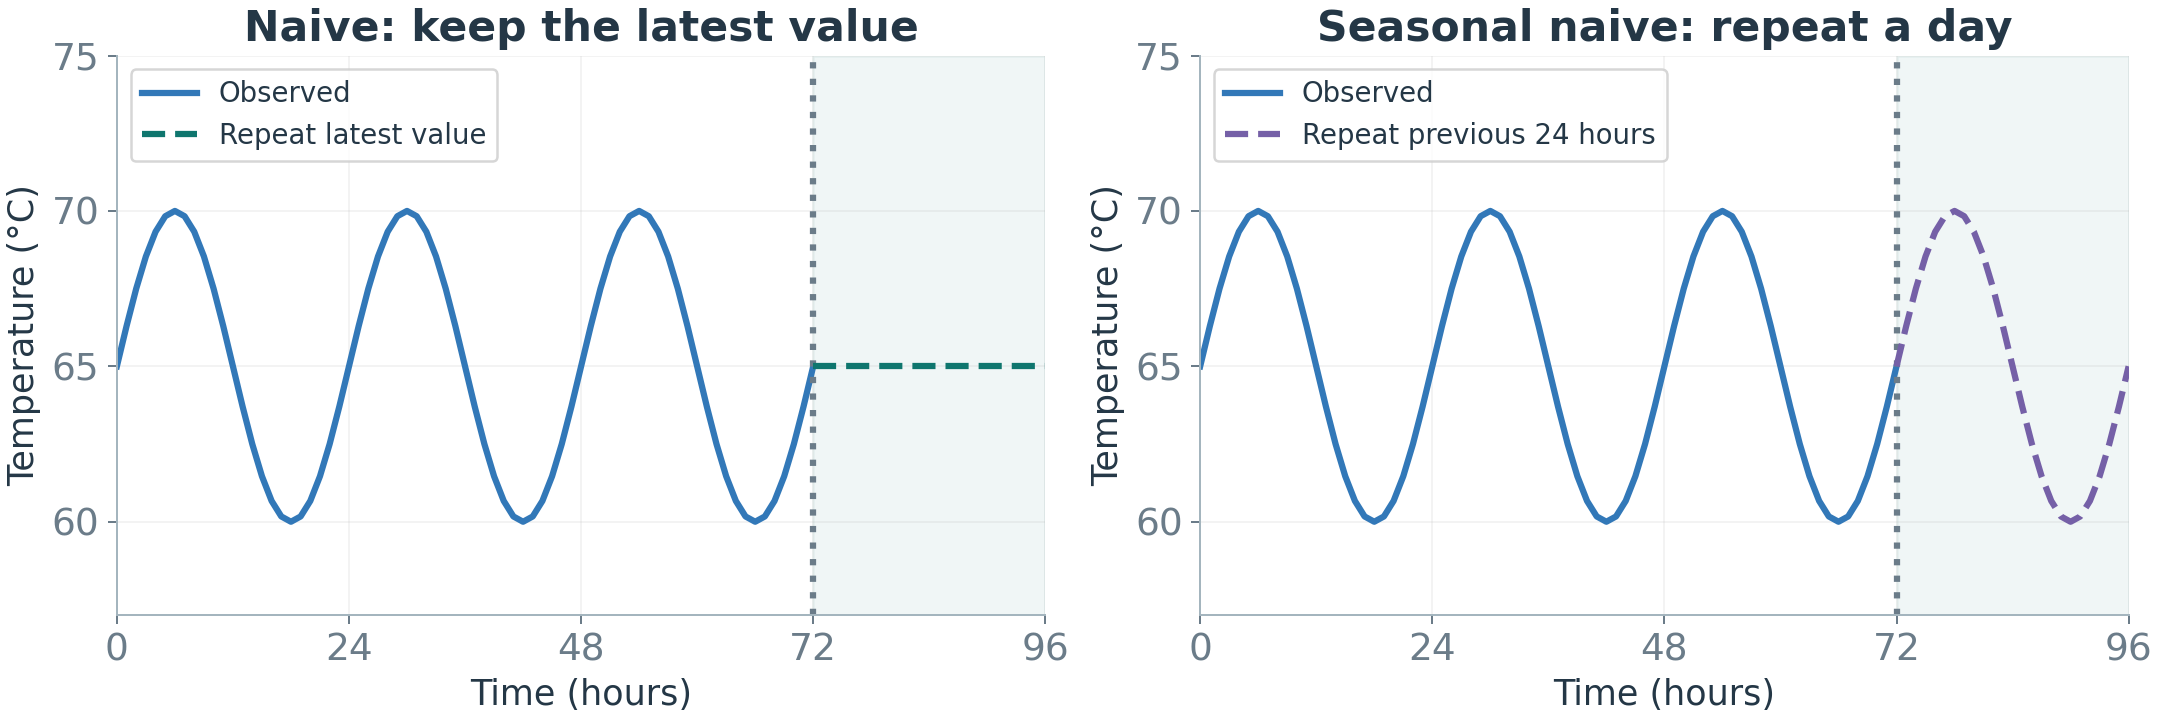
Naive: the next value equals the latest observation. Seasonal naive: repeat the value from the corresponding point in the last cycle. In decomposition terms, it reuses the seasonal pattern.
Fast and transparent, but unable to anticipate a new trend or operating regime.
If a complex model does not beat these baselines, reconsider its value.
Figure 9. Repeat the latest reading or the last known cycle.
I.C) Forecasting MethodsSmoothing: Estimate the Recent Level
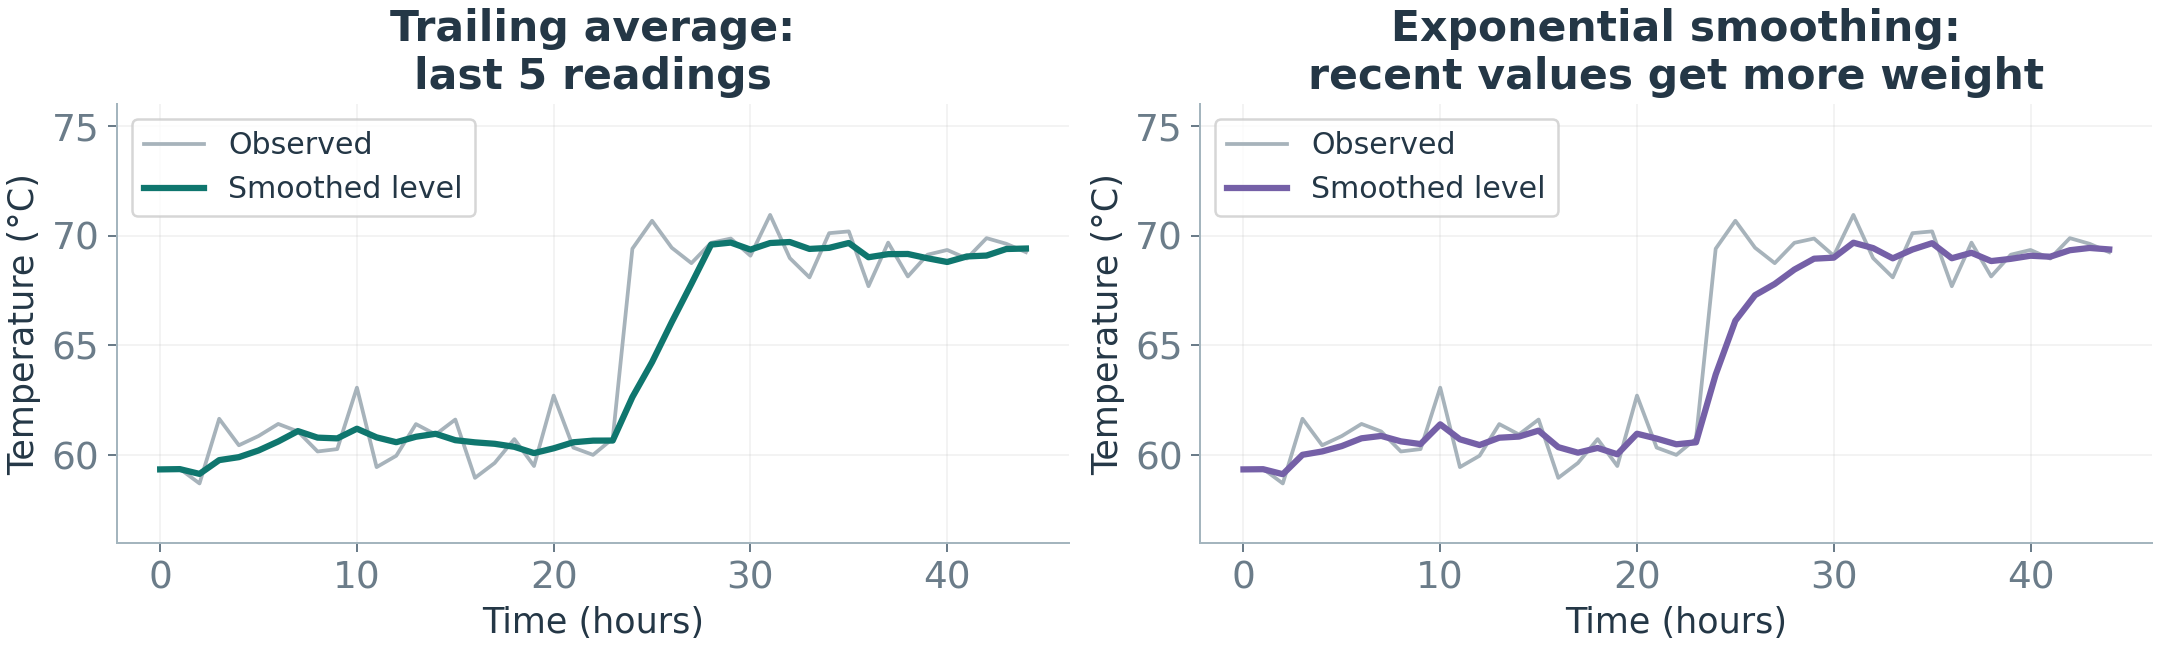
We want an estimate of the current level that smooths short-term fluctuations.
Moving average: average the latest few readings.
Exponential smoothing: combine the previous level and the latest reading using weighted averaging.
Example: previous level 70°C, new reading 80°C. Give the new reading 20% weight: 0.8\times70+0.2\times80=\mathbf{72}°C. Use 72°C as the next forecast.
Figure 10. Smoothing reduces short-term variation but responds after a change.
A larger weight reacts faster, but also follows more of the short-term variation.
I.C) Forecasting MethodsBefore ARIMA: Does the Pattern Stay Stable?
The next method, ARIMA, needs reasonably stable relationships in the series it models.
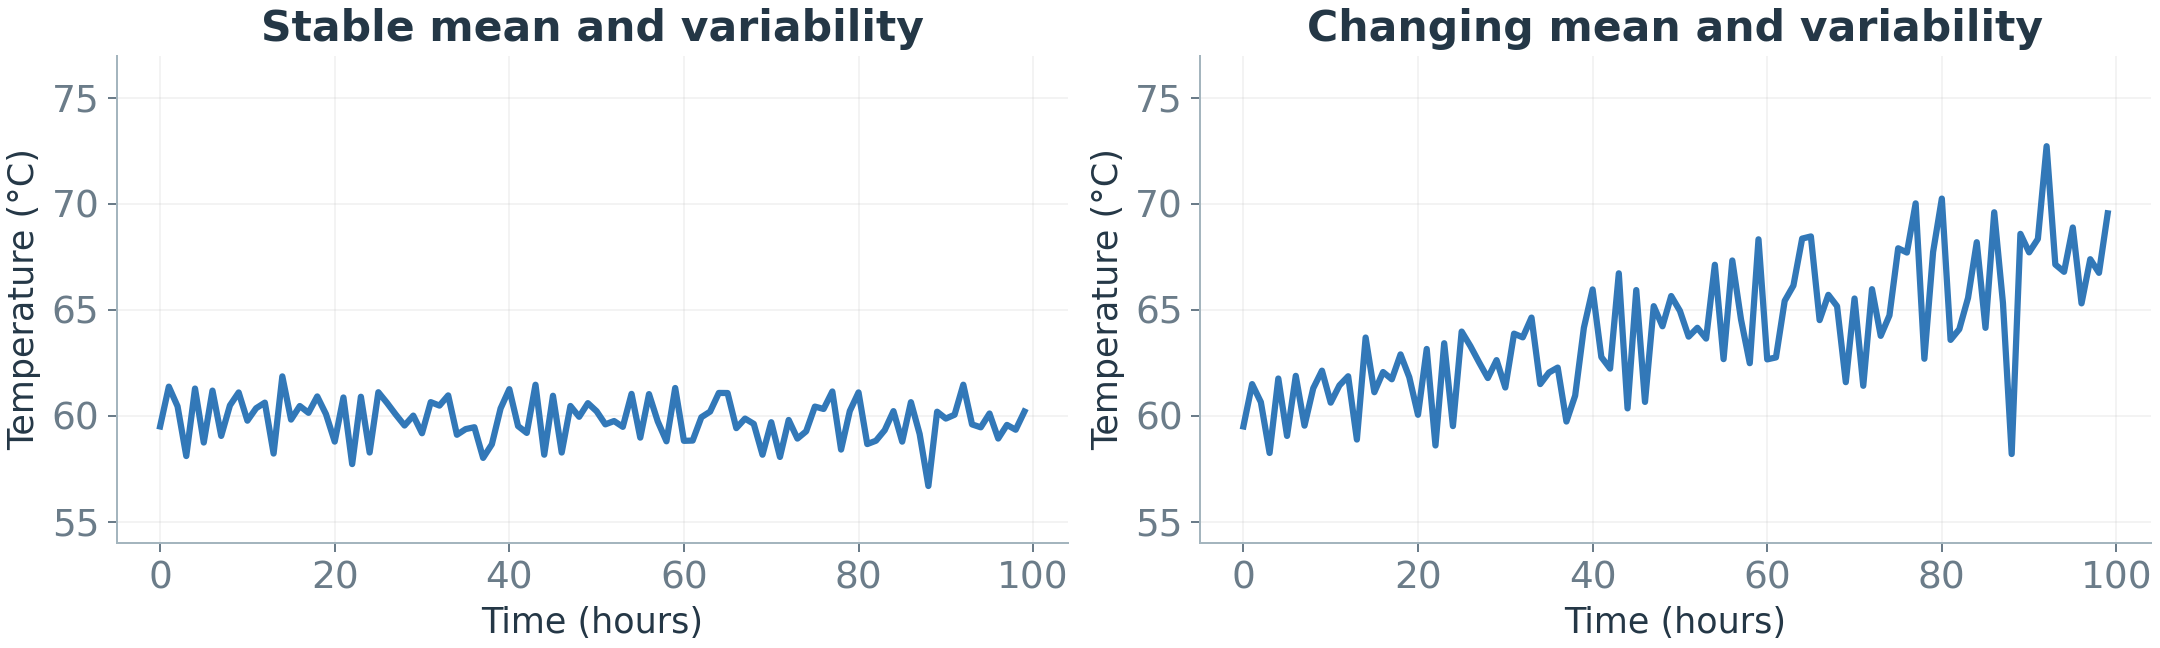
Stationarity means the average, spread, and relationships at a fixed time gap stay stable over time.
Figure 11. A stable level and spread on the left; a changing level and spread on the right.
Differencing stops looking at the value itself and looks at how much it changed: \Delta y_t=y_t-y_{t-1}.
Example: 10, 12, 14, 16, 18 keeps rising. Its changes are 2, 2, 2, 2: a stable pattern. The trend is gone.
Differencing can reduce a trend. It does not fix every type of change.
I.C) Forecasting MethodsARIMA: Combine History and Past Errors
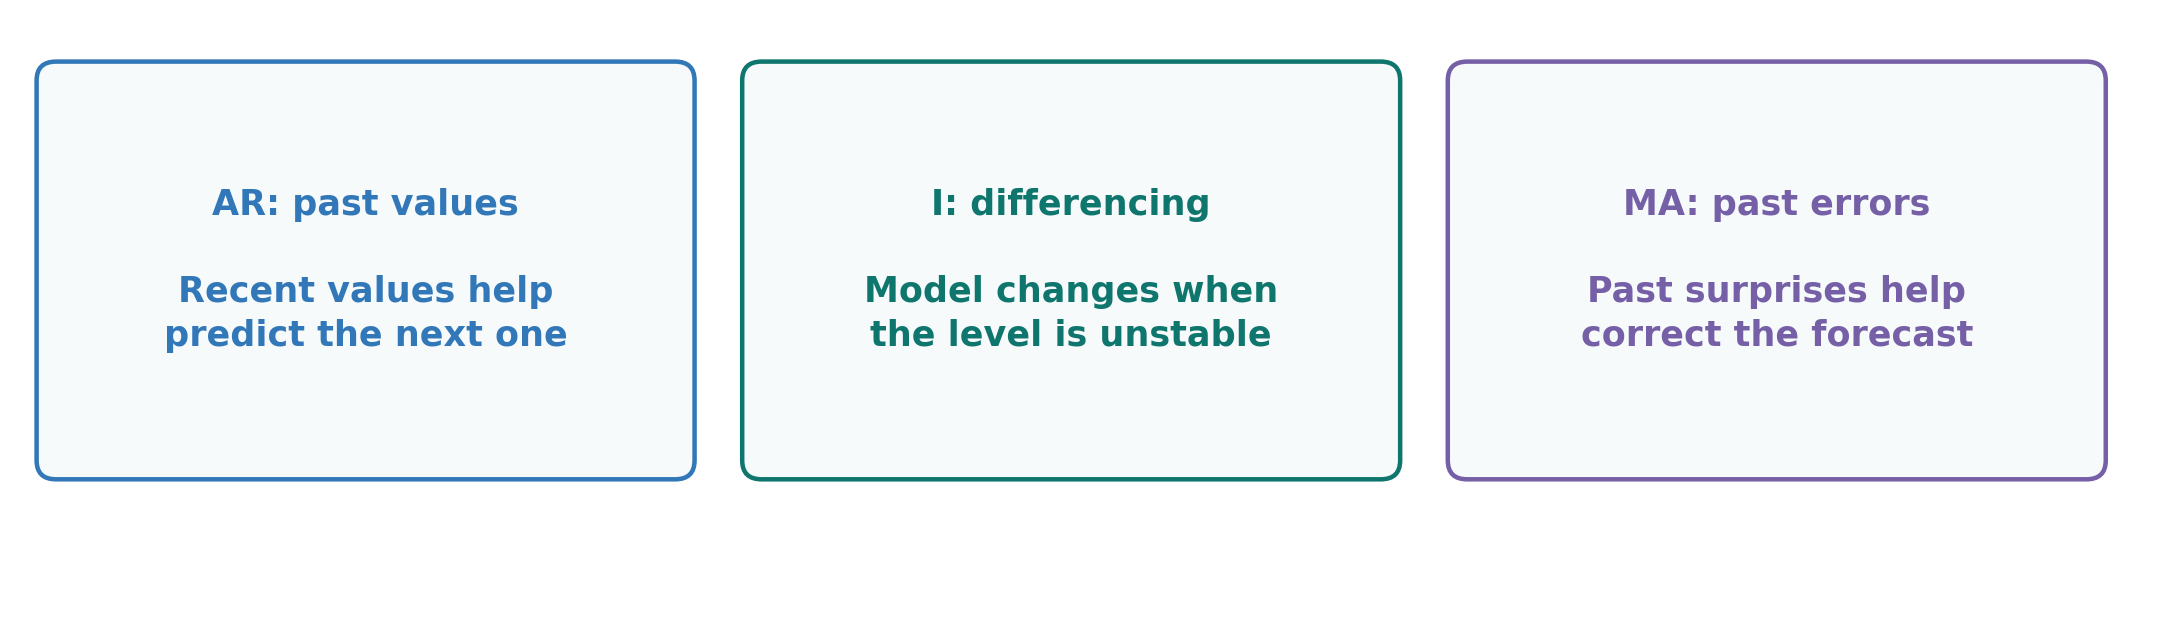
ARIMA combines past values, changes between readings, and past forecast errors.
Figure 12. ARIMA combines past values, differencing, and past forecast errors.
ARIMA(p,d,q): three numbers, one per ingredient.
p: how many past values to use. This is the AR part.
d: how many differencing steps. This is the I part.
q: how many past prediction mistakes to use. This is the MA part.
A past prediction mistake, or residual: forecast 70, actual 72, a miss of +2.
ARIMA(2,1,1) differences the series once, then models the differenced series using two past lagged values and one past residual.
I.C) Forecasting MethodsLag Features: Turning History into Training Examples
A training example pairs available history with the value that came next. Lags are counted back from that target, just as in the earlier timeline.
Try it: for 10, 12, 14, 17, 18, use three past readings to predict the next one.
Table 1. Each row is one past forecasting example.
Lag 3
Lag 2
Lag 1
Target
10
12
14
17
12
14
17
18
Once 18 arrives, the next input row is 14, 17, 18. Its target is still unknown.
A model learns a relationship between the input columns and the target column.
I.C) Forecasting MethodsSequence Models: Learning from Ordered History
Keep the same task: use 10, 12, 14 to predict the next reading.
A sequence model learns from readings in time order. It can learn patterns across a longer history instead of relying only on summaries we chose.
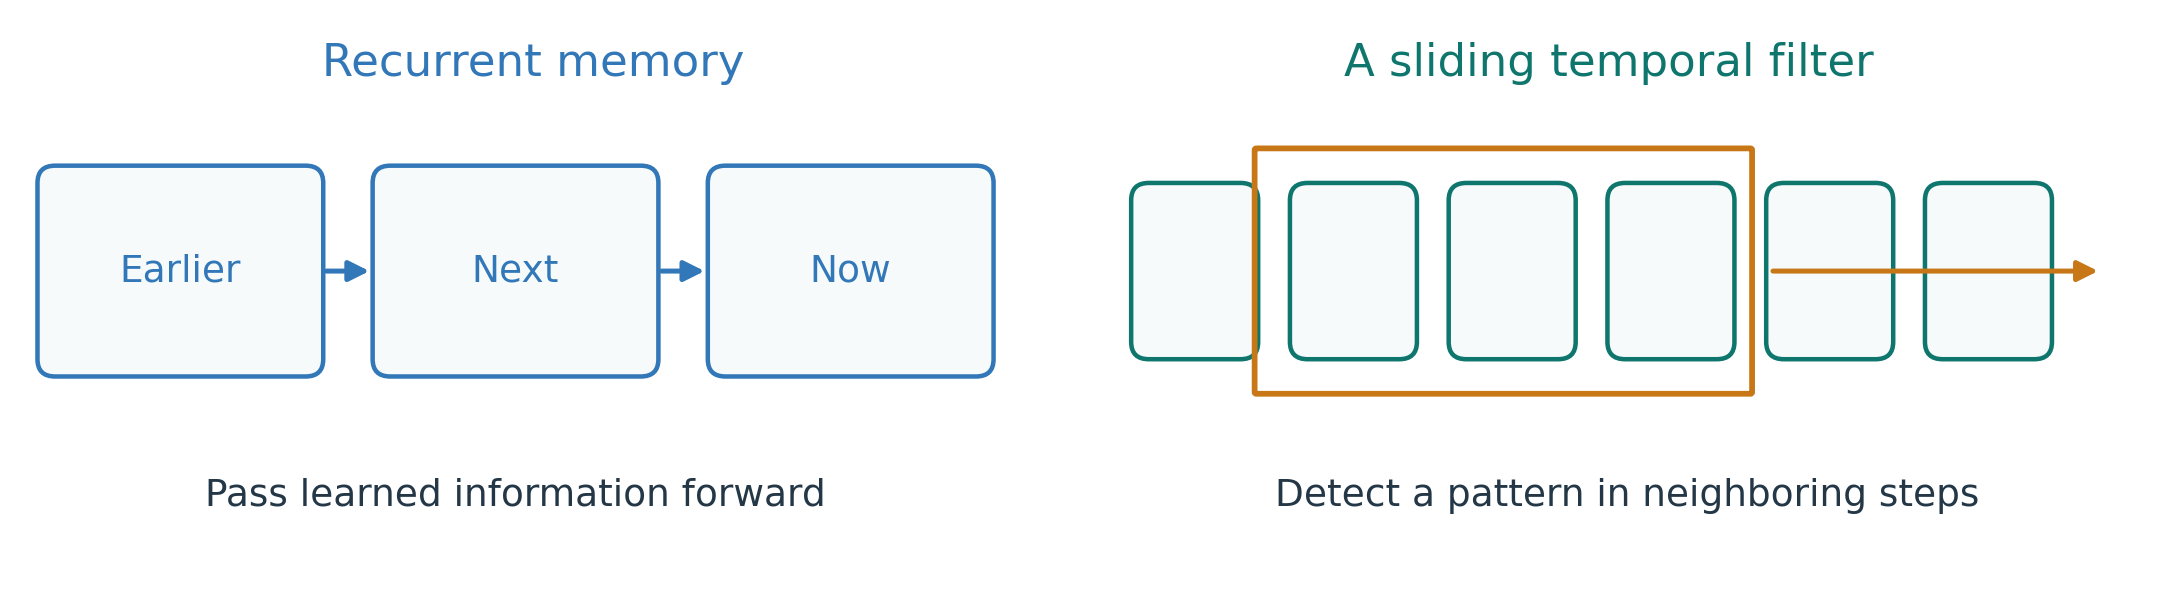
Recurrent neural network (RNN): update a learned memory as each reading is processed.
Temporal convolution: move a learned filter across nearby readings to detect short patterns.
Figure 13. Sequence models can retain information over time or detect patterns in short windows.
Both approaches learn patterns in history to forecast the next reading.
I.C) Forecasting MethodsAttention: Connecting Distant Times
What if a useful pattern occurred one day ago, rather than in the latest few readings?
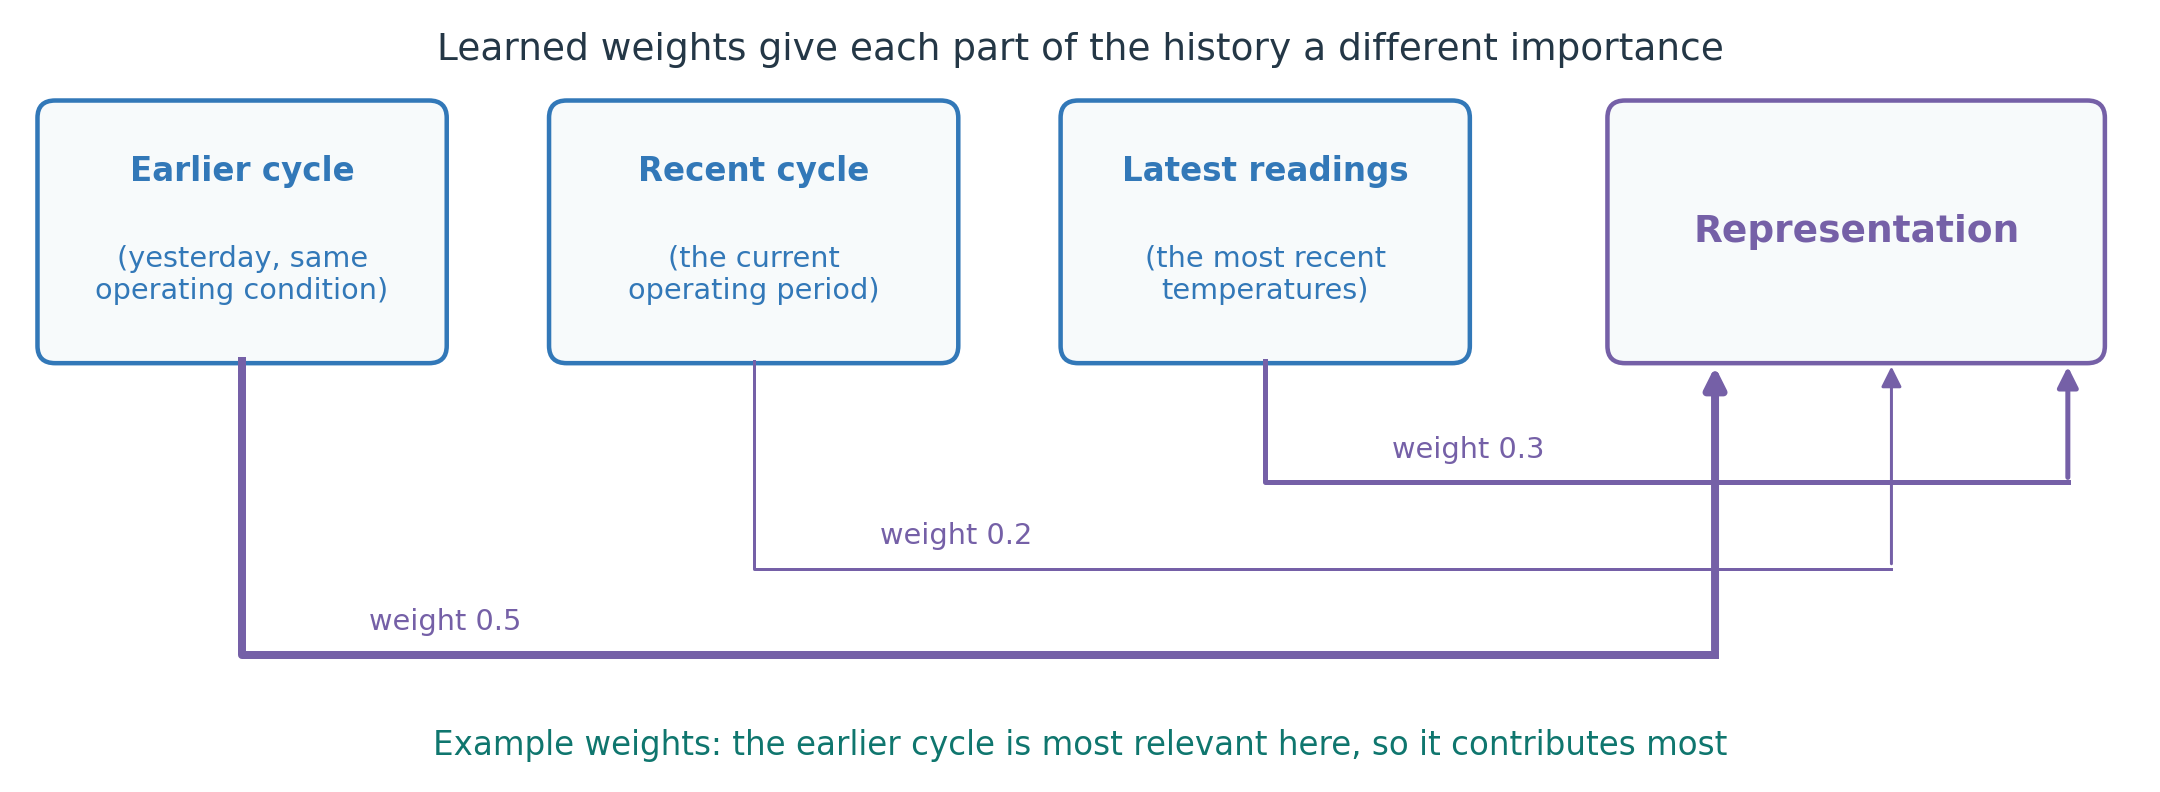
Attention learns how much information to use from different parts of the available history. A Transformer is a model that uses this mechanism.
Example: the model weights the earlier cycle 0.5, the recent cycle 0.2, the latest readings 0.3. The most relevant part contributes most.
Figure 14. Attention combines information from relevant parts of the observed history.
Attention can connect distant readings, but longer histories require more computation.
y_t: the actual value at time t; \hat{y}_t: its forecast; n: the number of forecasts, here 3.
Start with MAE. MAPE breaks near zero, so never use it on Celsius temperature.
I.D) Evaluating ForecastsWalk-Forward Validation: Testing Several Forecast Origins
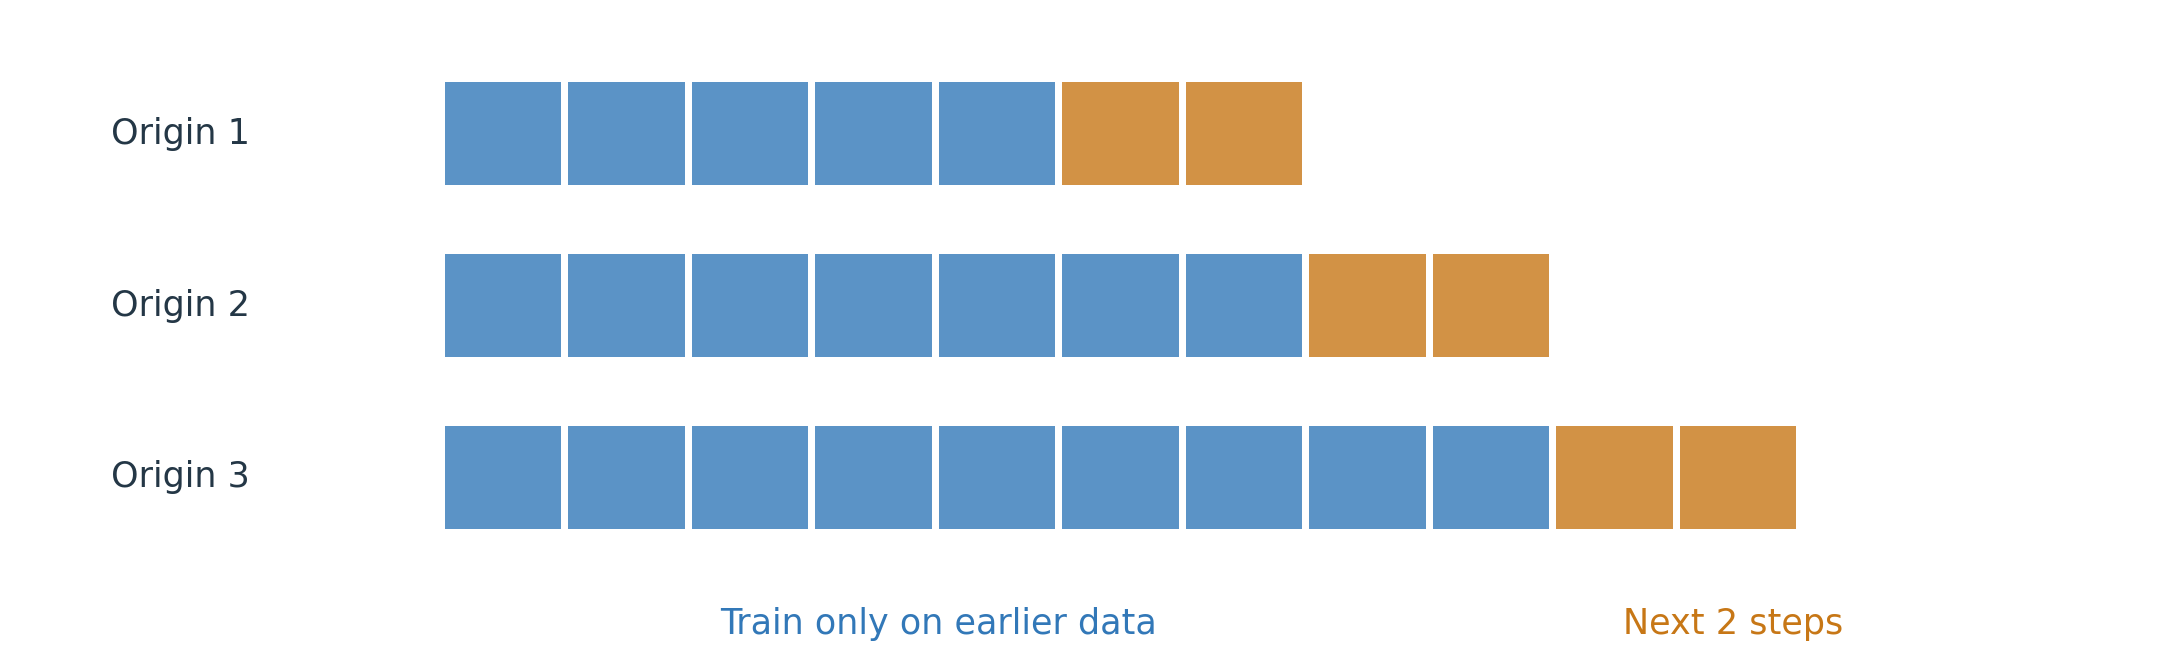
Walk-forward validation repeats forecasting at successive points in time.
At each origin: fit using earlier data, predict the required horizon, and record the errors.
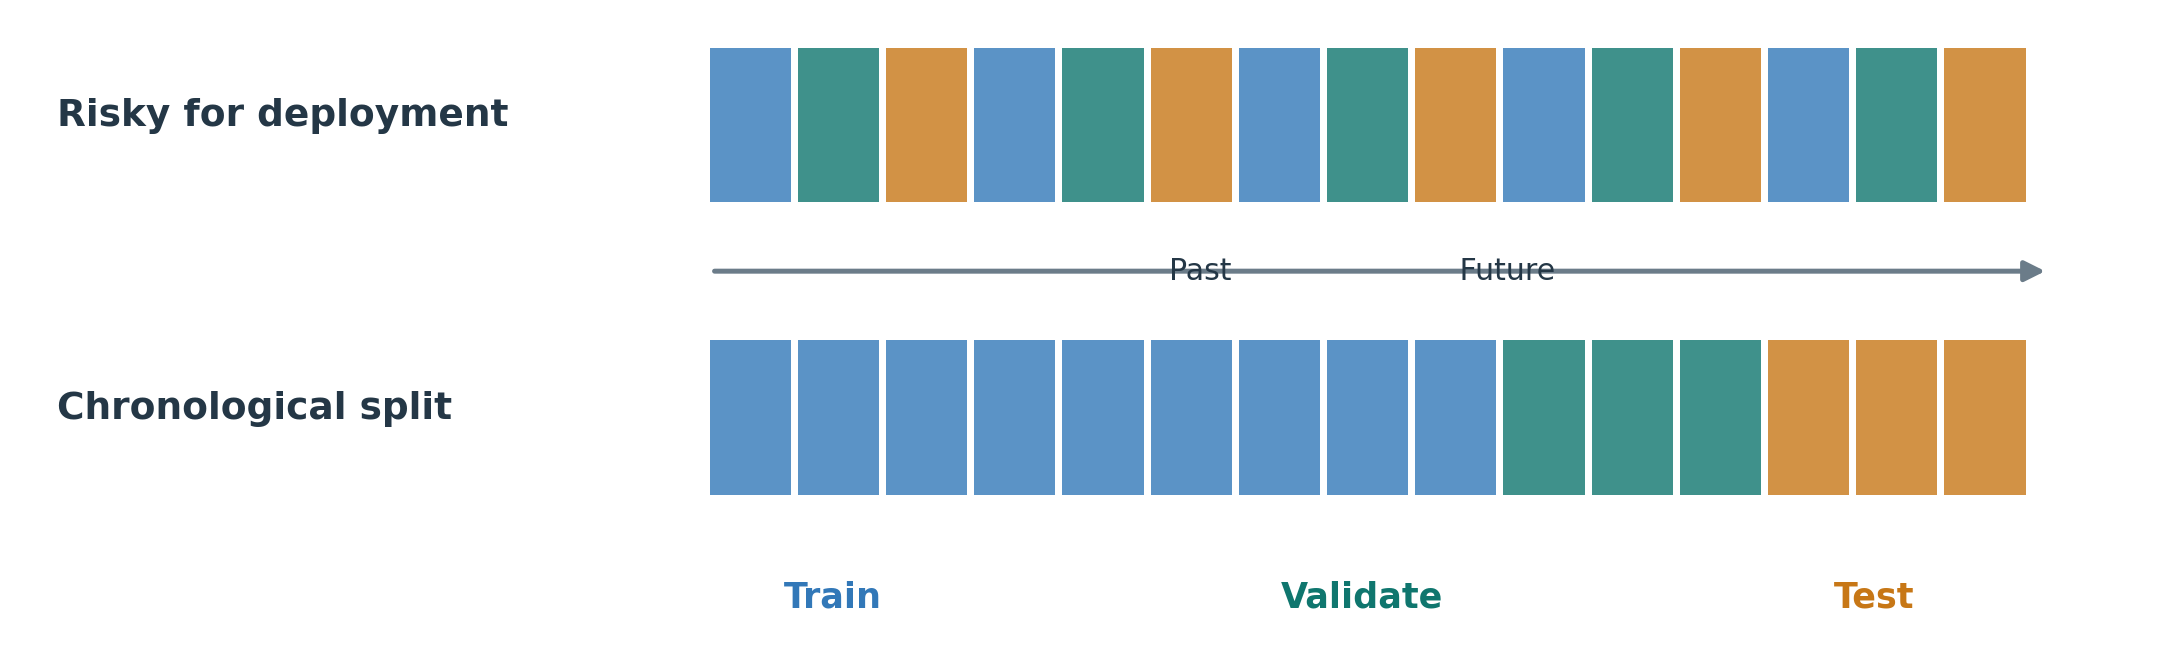
This tests performance across several periods, not only one convenient split.
Figure 18. Expanding training history with a two-step forecast horizon.
I.D) Evaluating ForecastsExercise: Walk Forward with a Naive Forecast
Series: 10, 12, 14, 17, 18. At each origin, predict that the next value equals the latest observed value.
Try it (3 minutes): fill in the three missing errors, then compute their MAE.
Table 3. Each forecast uses only the history available at that origin.
Origin
Forecast
Next actual value
Absolute error
After 12
12
14
…
After 14
14
17
…
After 17
17
18
…
We will solve it together. Notice what each forecast is allowed to see at its origin.
I.D) Evaluating ForecastsPrediction Intervals: Forecasting a Range
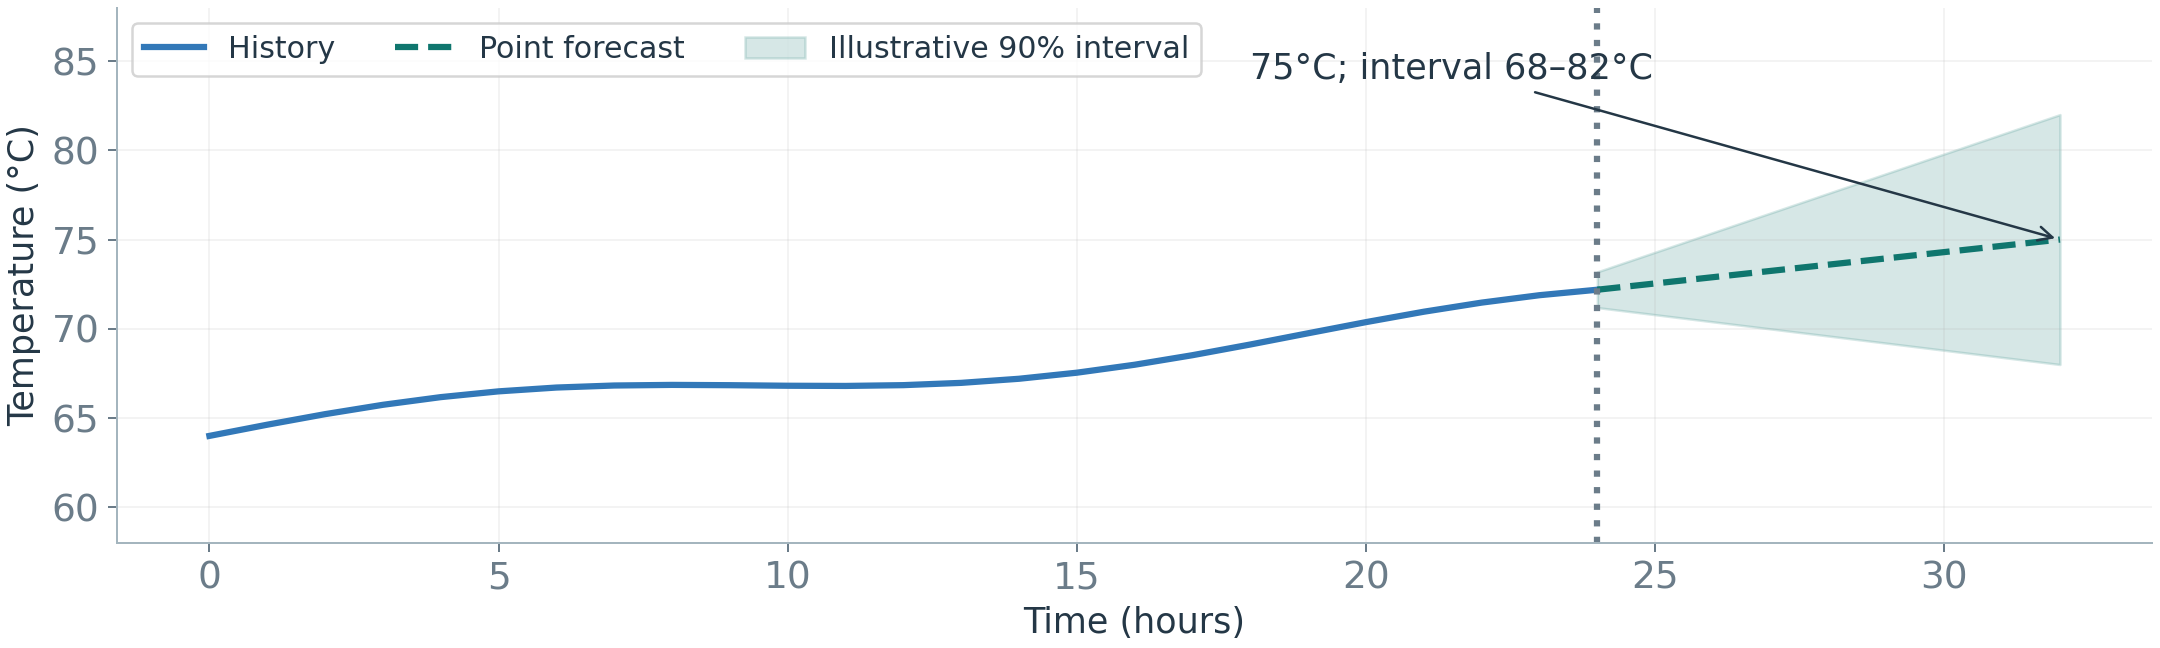
A prediction interval describes uncertainty about a future observation, not a safe operating range.
Example: 75°C, with an illustrative 90% interval of 68 to 82°C.
Observed coverage = test observations inside their intervals / test observations checked. If 90 of 100 are inside, coverage is 90%.
Check coverage and interval width together. Very wide intervals can cover almost everything yet offer little decision value.
Figure 19. Forecast uncertainty can grow with the horizon.
I.E) Distribution Shift and AdaptationModel Degradation: Monitoring Forecast Errors
A model performed well when we tested it. Will it stay accurate during daily use?
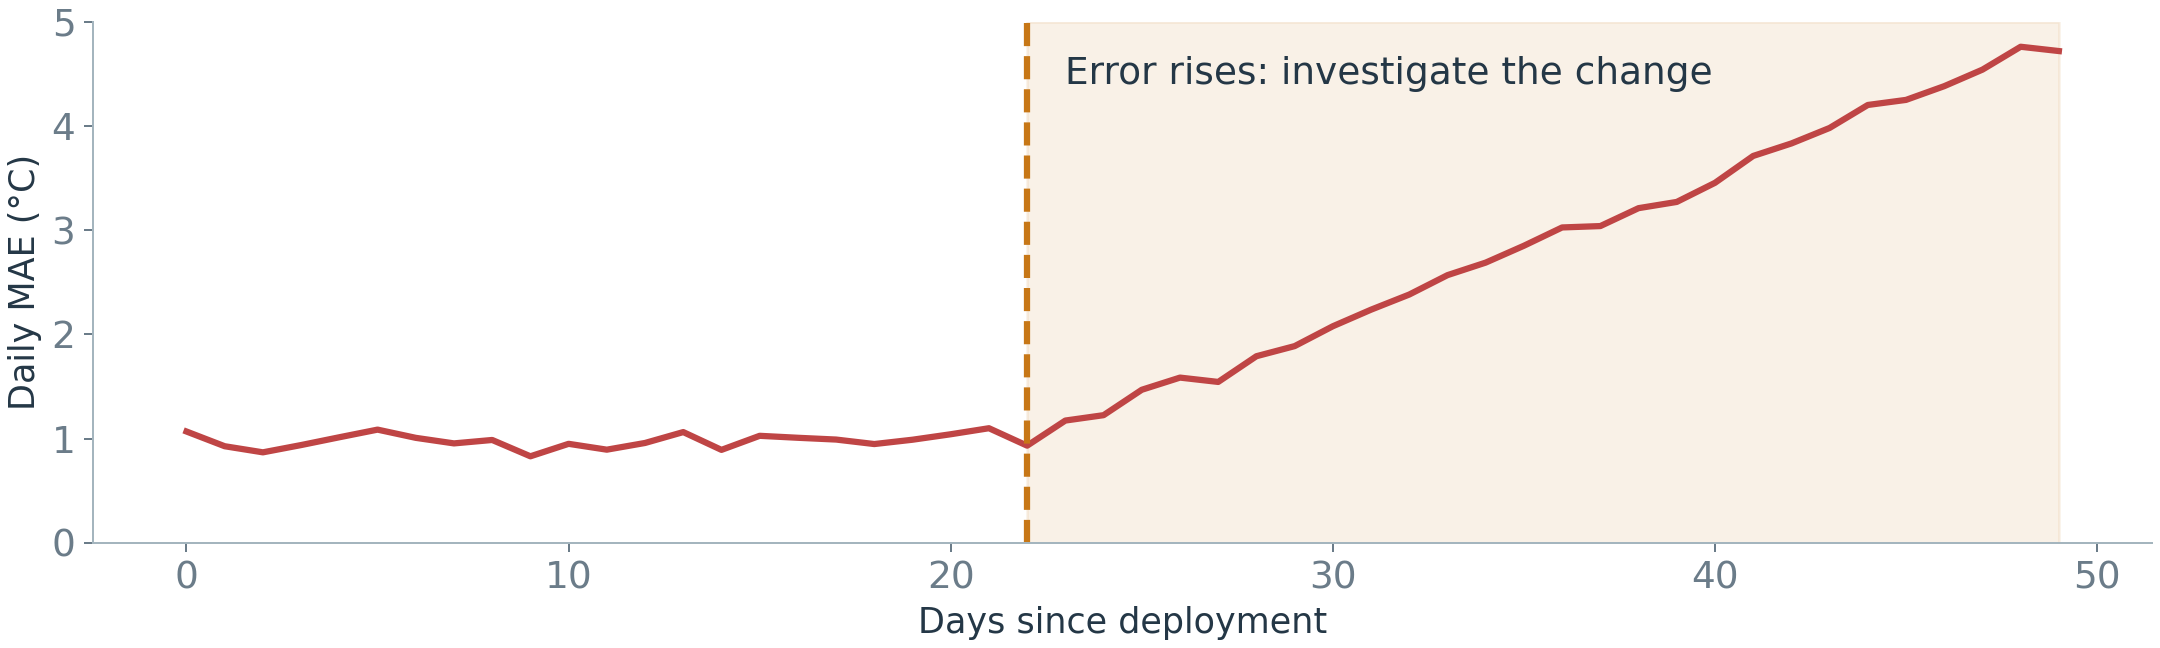
Model degradation means its predictions become less accurate over time. Compare forecasts with actual readings as those readings arrive.
Figure 20. An increase in forecast error is a reason to investigate.
Next question: did the operating conditions change, or did the machine behave differently under the same conditions?
I.E) Distribution Shift and AdaptationCovariate Shift and Concept Drift: What Changes?
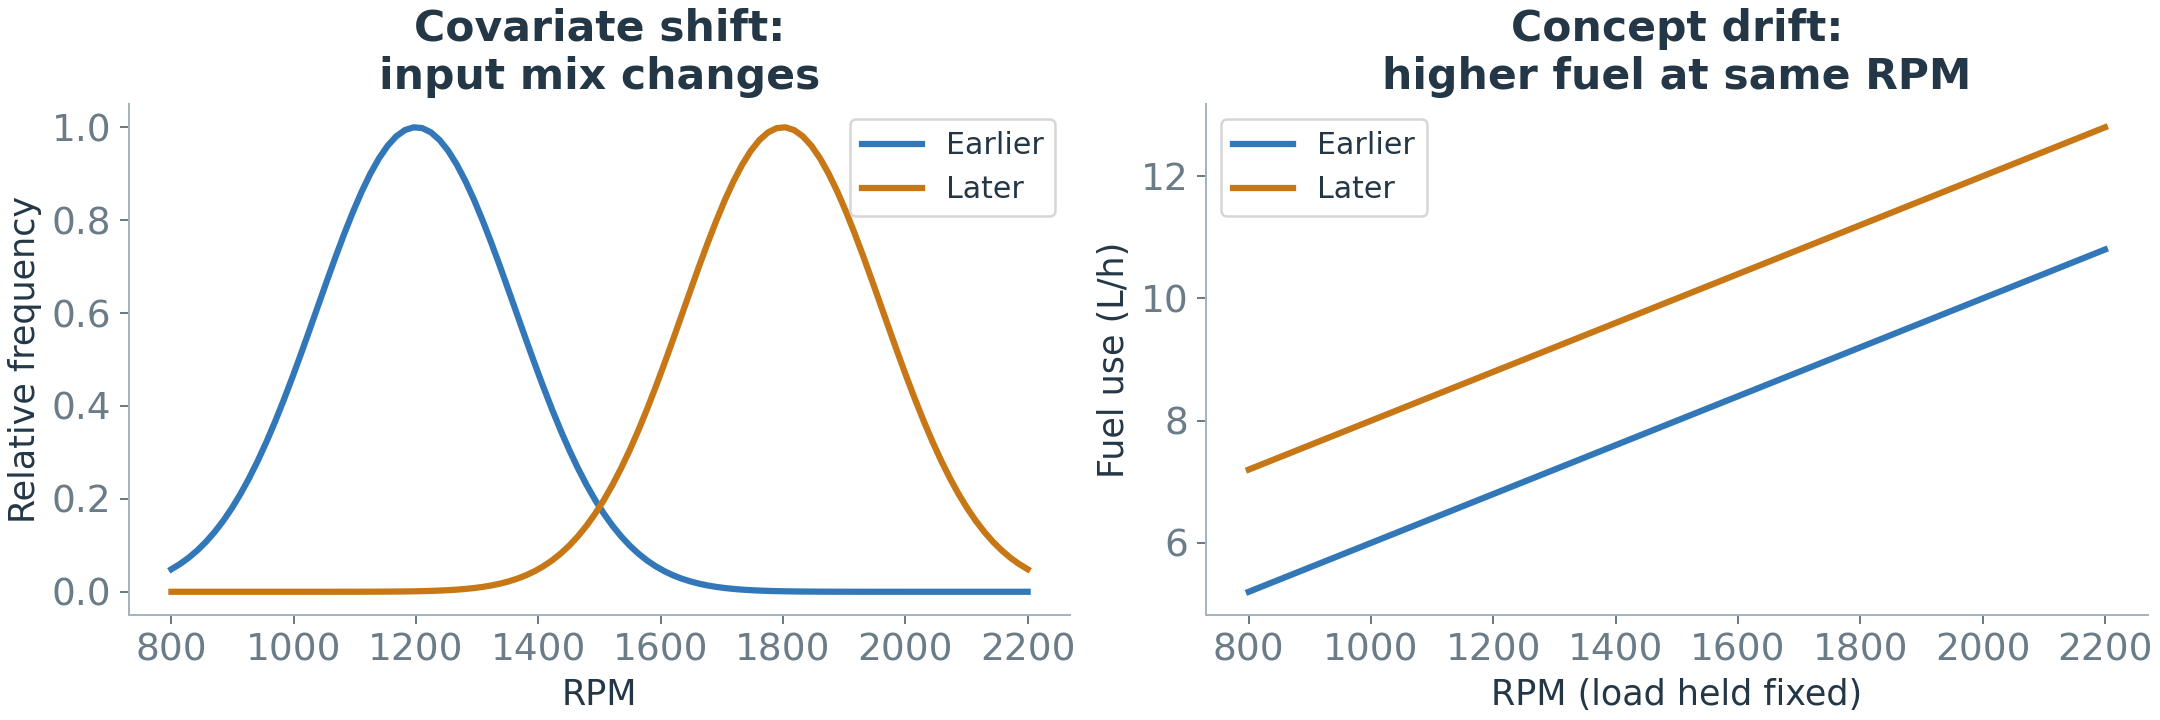
Rising errors can have different causes. Compare these two possibilities:
Input change (covariate shift): more high-RPM operation; unchanged fuel use at the same RPM and load.
Relationship change (concept drift): more fuel use at the same RPM and load.
Figure 21. Different inputs versus a changed relationship between inputs and output.
Check conditions and forecast errors before updating the model.
I.E) Distribution Shift and AdaptationDrift Patterns: Sudden, Gradual, Incremental, and Recurring
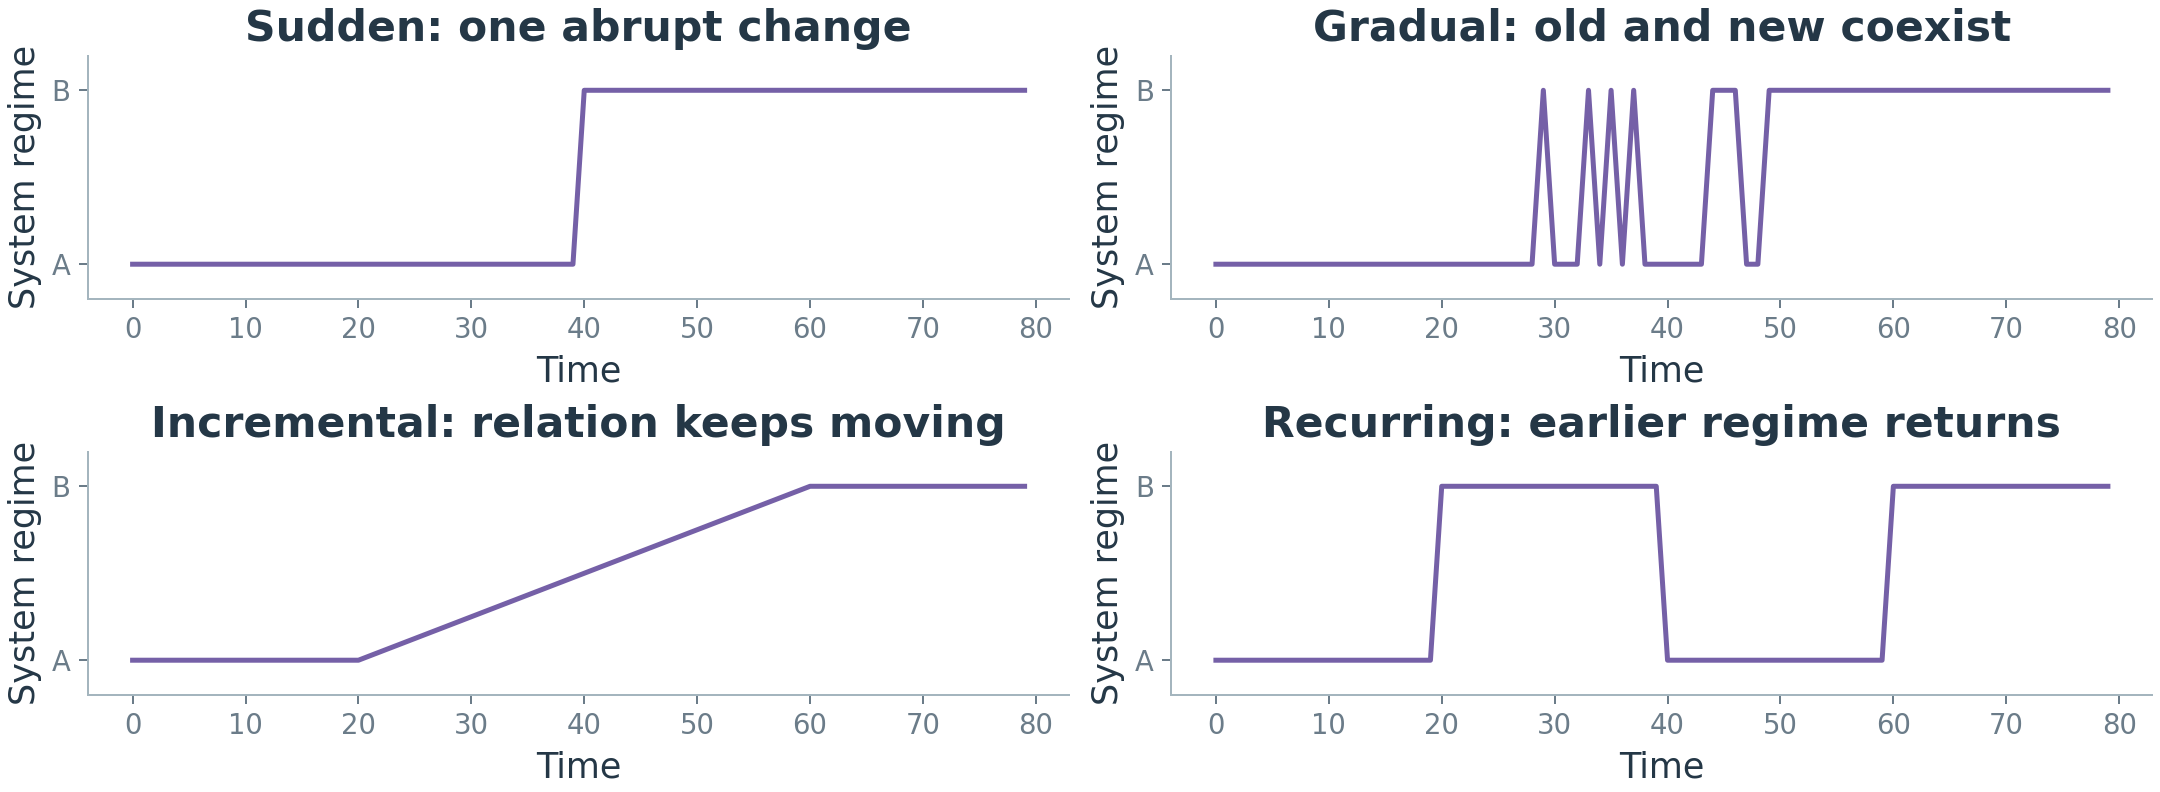
Sudden: abrupt replacement. Gradual: old and new behavior coexist during a transition. Incremental: the relationship keeps moving. Recurring: an earlier regime returns.
Quick question (1 minute): which panel fits a sensor replaced in one step? Which fits a machine that wears a little more each month?
Figure 22. Four schematic patterns of system change.
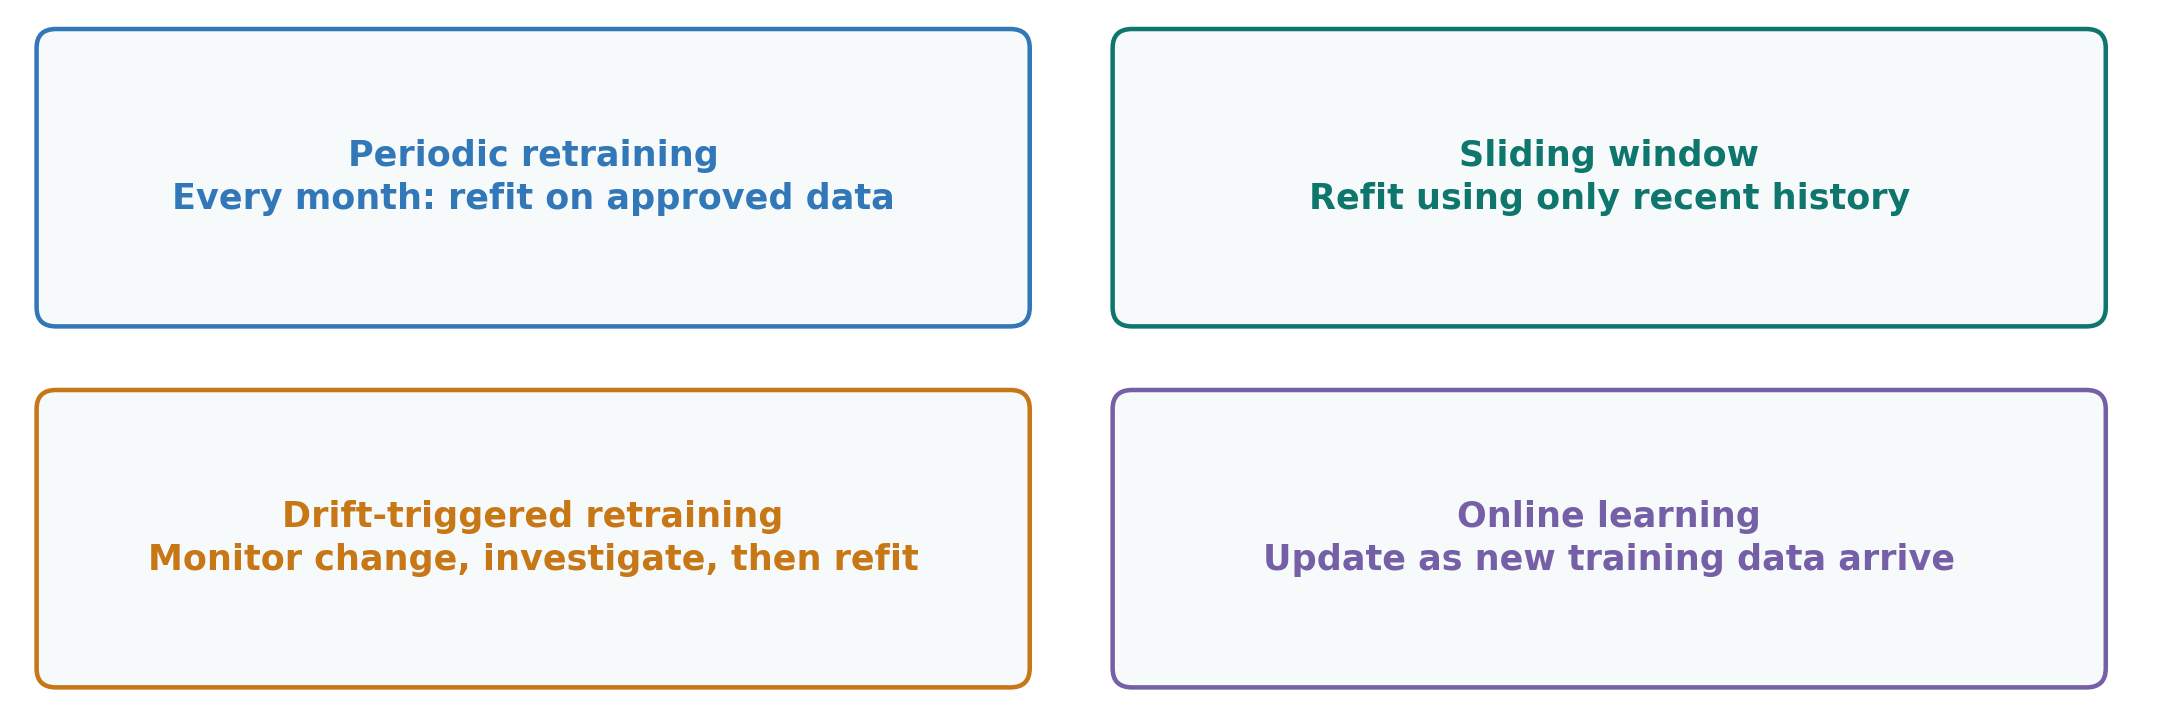
I.E) Distribution Shift and AdaptationAdaptation: Four Ways to Update a Model
Periodic retraining: refit on a schedule.
Sliding window: use only recent history.
Drift-triggered retraining: investigate a detected change, then refit.
Online learning: update incrementally as training data arrive.
Test each update on later data before relying on it. First investigate why performance changed.
Figure 23. Update strategies can be combined.
I) ForecastingFrom Prediction to Monitoring
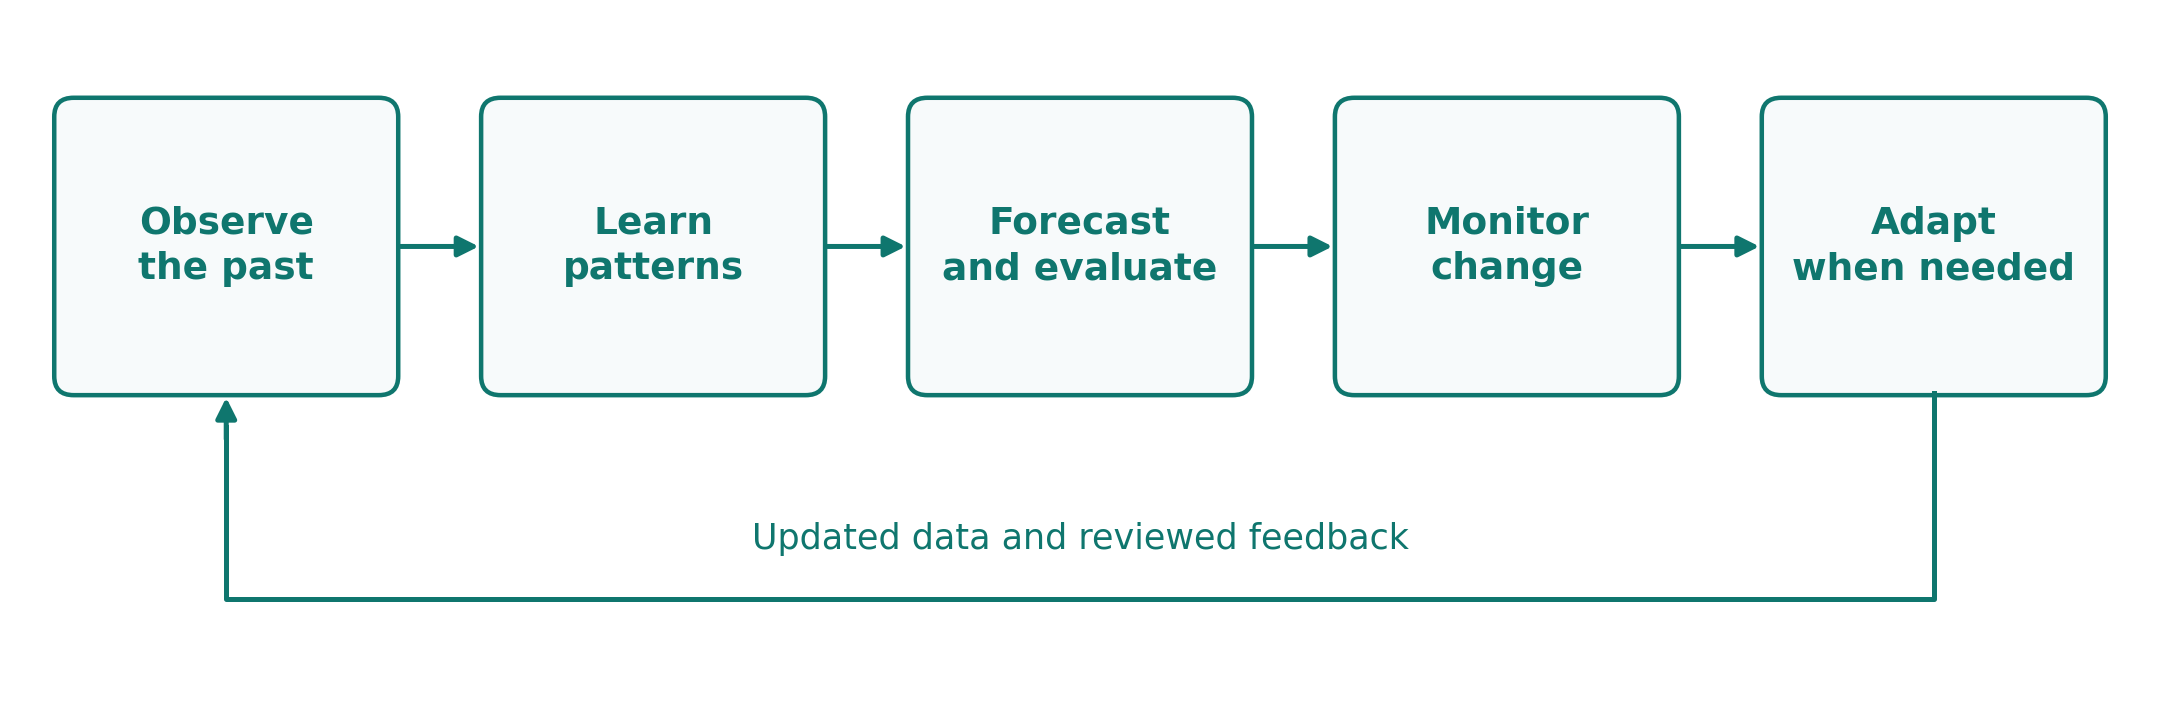
A useful forecast needs an appropriate baseline, honest evaluation, and monitoring.
Discuss: if errors rise after a sensor replacement, what would you check before retraining?
Forecasting asks what we expect next. Now we ask whether the observed behavior is unusual.
Figure 24. Forecasting is an ongoing process.
BREAK
After the break: how can a model recognize unusual behavior?
II.A) Understanding AnomaliesAnomalies: A Reason to Investigate
Part I taught us what to expect. Part II asks: what if the actual behavior does not match?
An anomaly is an observation or pattern that differs meaningfully from expected behavior. A temperature spike might reflect a fault, a sensor problem, or a valid operating event.
Anomaly detection tells us where to investigate. It does not establish the cause.
Figure 25. A deviation is evidence to examine, not a diagnosis.
A normal reference is evidence we trust to describe expected behavior under the relevant operating conditions.
Example: a period an engineer confirms was healthy, covering both low and high loads.
Possible forms: limits, typical values, similar examples, or a forecast.
Main risk: a reference with hidden faults or missing conditions can be misleading.
Without confirmed healthy data, a method still needs assumptions. For example, it may treat rare, isolated readings as unusual.
Ask first: what evidence tells us what normal behavior should look like?
II.A) Understanding AnomaliesDetection Challenges: Rare Events and Changing Conditions
Rare events: 990 normal examples may accompany only 10 anomalies.
Few labels: engineers may not know which past readings were abnormal.
Unknown events: future faults may differ from known examples.
Noise: random variation can resemble a problem.
Changing normality: a valid new operating regime may look unusual.
Why does this list matter? Every detection method in the next section is an answer to these difficulties. Each method builds its own picture of normal behavior in a different way, and then flags the readings that do not fit that picture.
II.A) Understanding AnomaliesAnomaly Types: Points, Context, and Sequences
Before building any detector, know what shapes an anomaly can take.
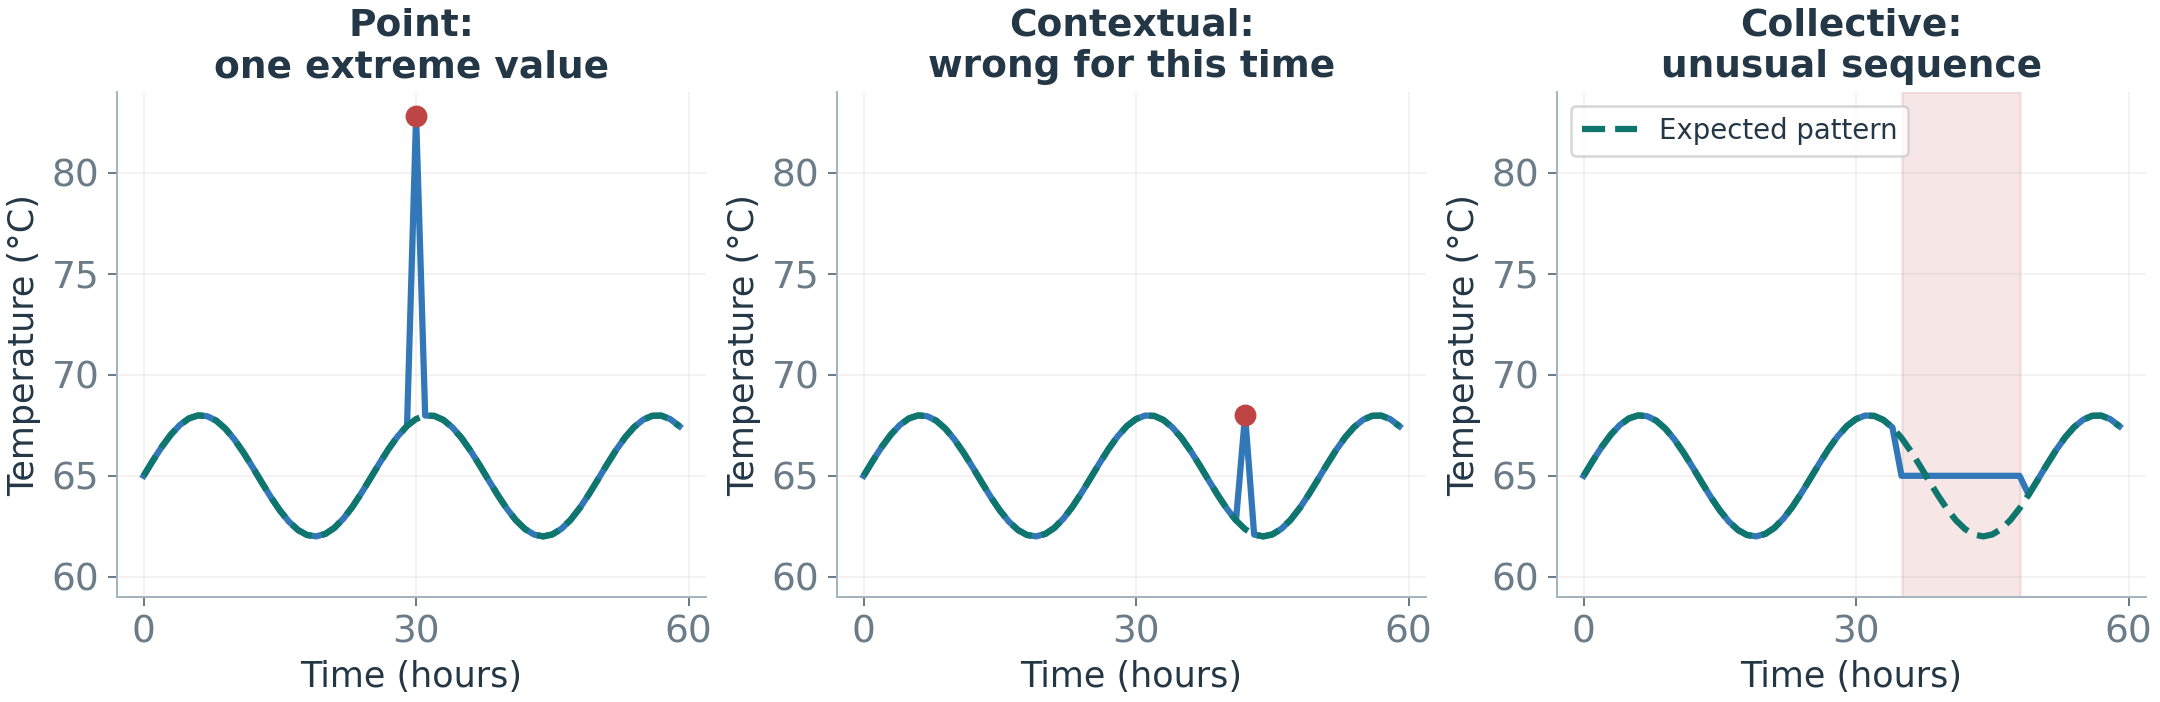
A point is unusual alone. A contextual anomaly is unusual for its time or condition. A collective anomaly is an unusual pattern across several readings.
Choose a representation that preserves the context needed to detect the problem.
Figure 26. Different anomalies require different evidence.
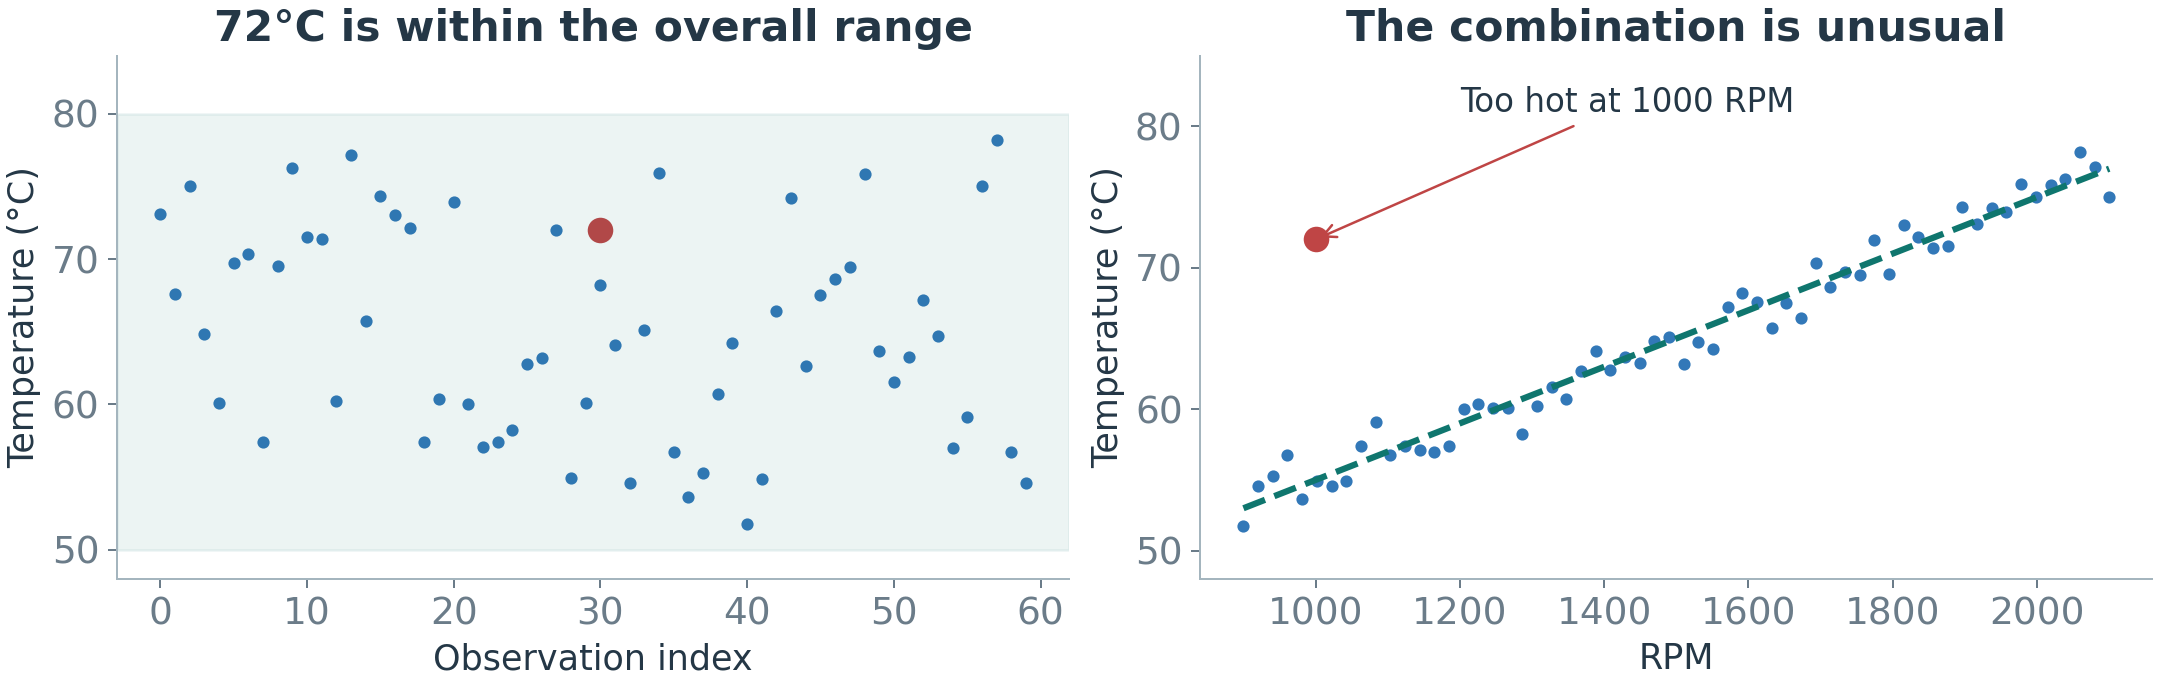
A temperature of 72°C can be normal at high RPM but unusual at 1,000 RPM.
Univariate detection examines one variable. Multivariate detection examines several variables and their relationships.
Separate sensor limits can miss an inconsistent combination.
Figure 27. The operating condition changes how a value is interpreted.
II.B) Defining Normal BehaviorLearning Settings: What Labels Are Available?
A label records what an example represents, such as normal operation or a confirmed failure.
The labels available for training determine what we can teach a detector.
Table 4. Different training evidence leads to different learning tasks.
Setting
Available examples
What we teach the model
Supervised
900 normal, 100 failure labels
Distinguish the known classes
Normal-only / one-class
900 examples confirmed normal
Learn normal, flag departures
Unsupervised
1,000 examples, no labels
Search for unusual patterns
A method’s name does not determine its setting. What matters is the data used to train it.
II.B) Defining Normal BehaviorFrom an Unusualness Score to an Alert
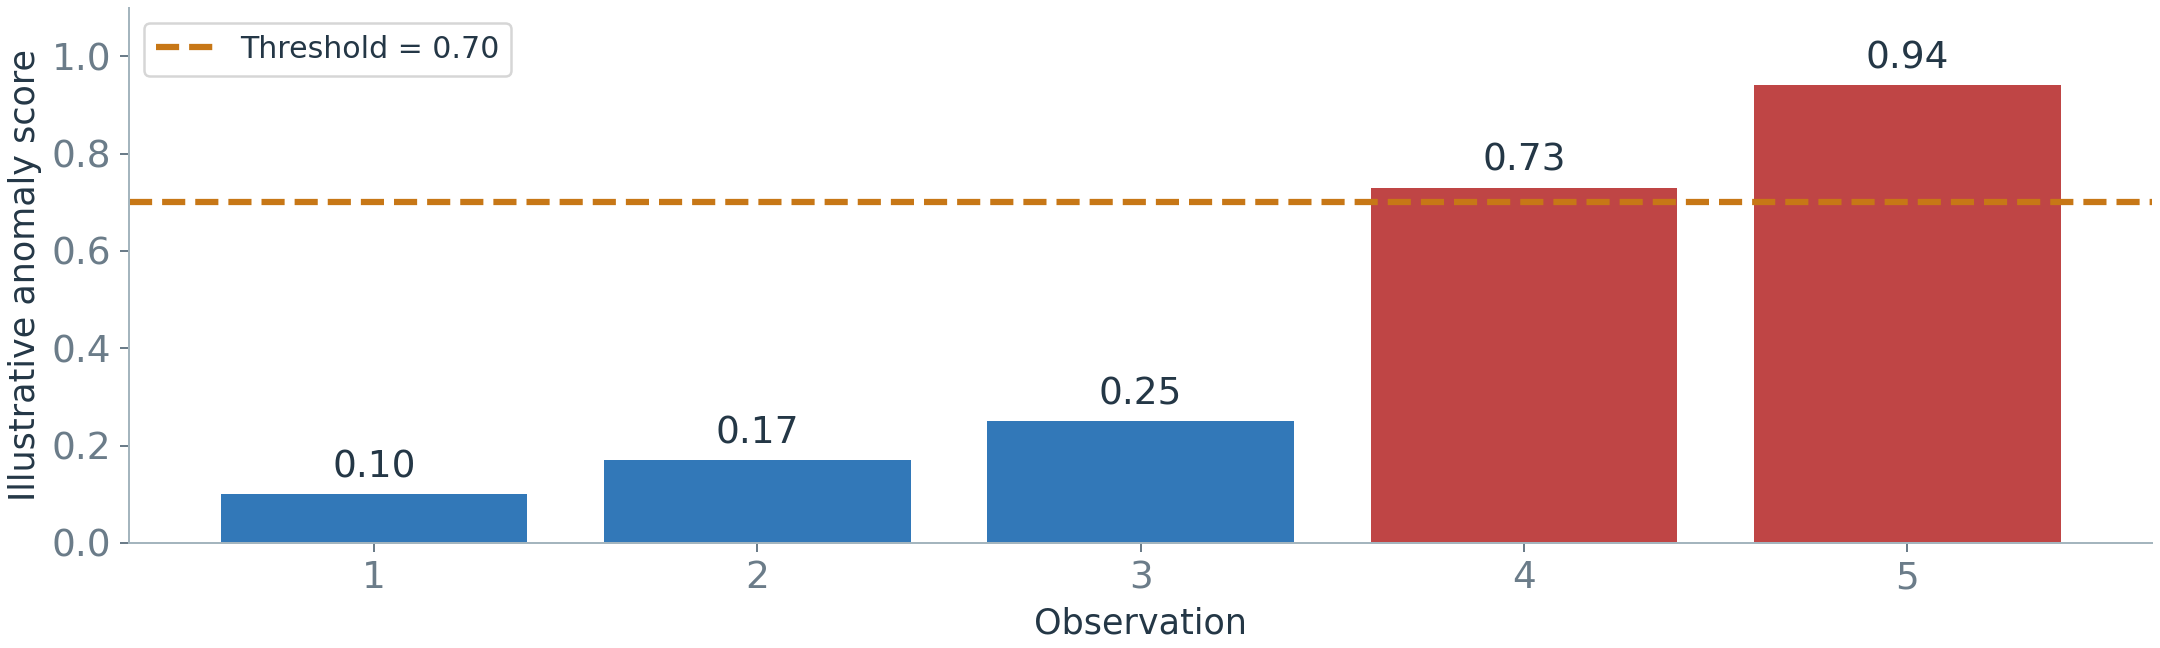
An anomaly score measures how unusual a reading or pattern looks to a detector. In this example, higher means more unusual.
A threshold is the cutoff for raising an alert: score > 0.70 → alert.
Figure 28. The two scores above the cutoff produce alerts.
A score of 0.94 is not automatically a 94% chance of failure. Some methods use different scales; a fixed rule may directly return yes or no.
II.B) Defining Normal BehaviorWhat Does Each Detection Method Check?
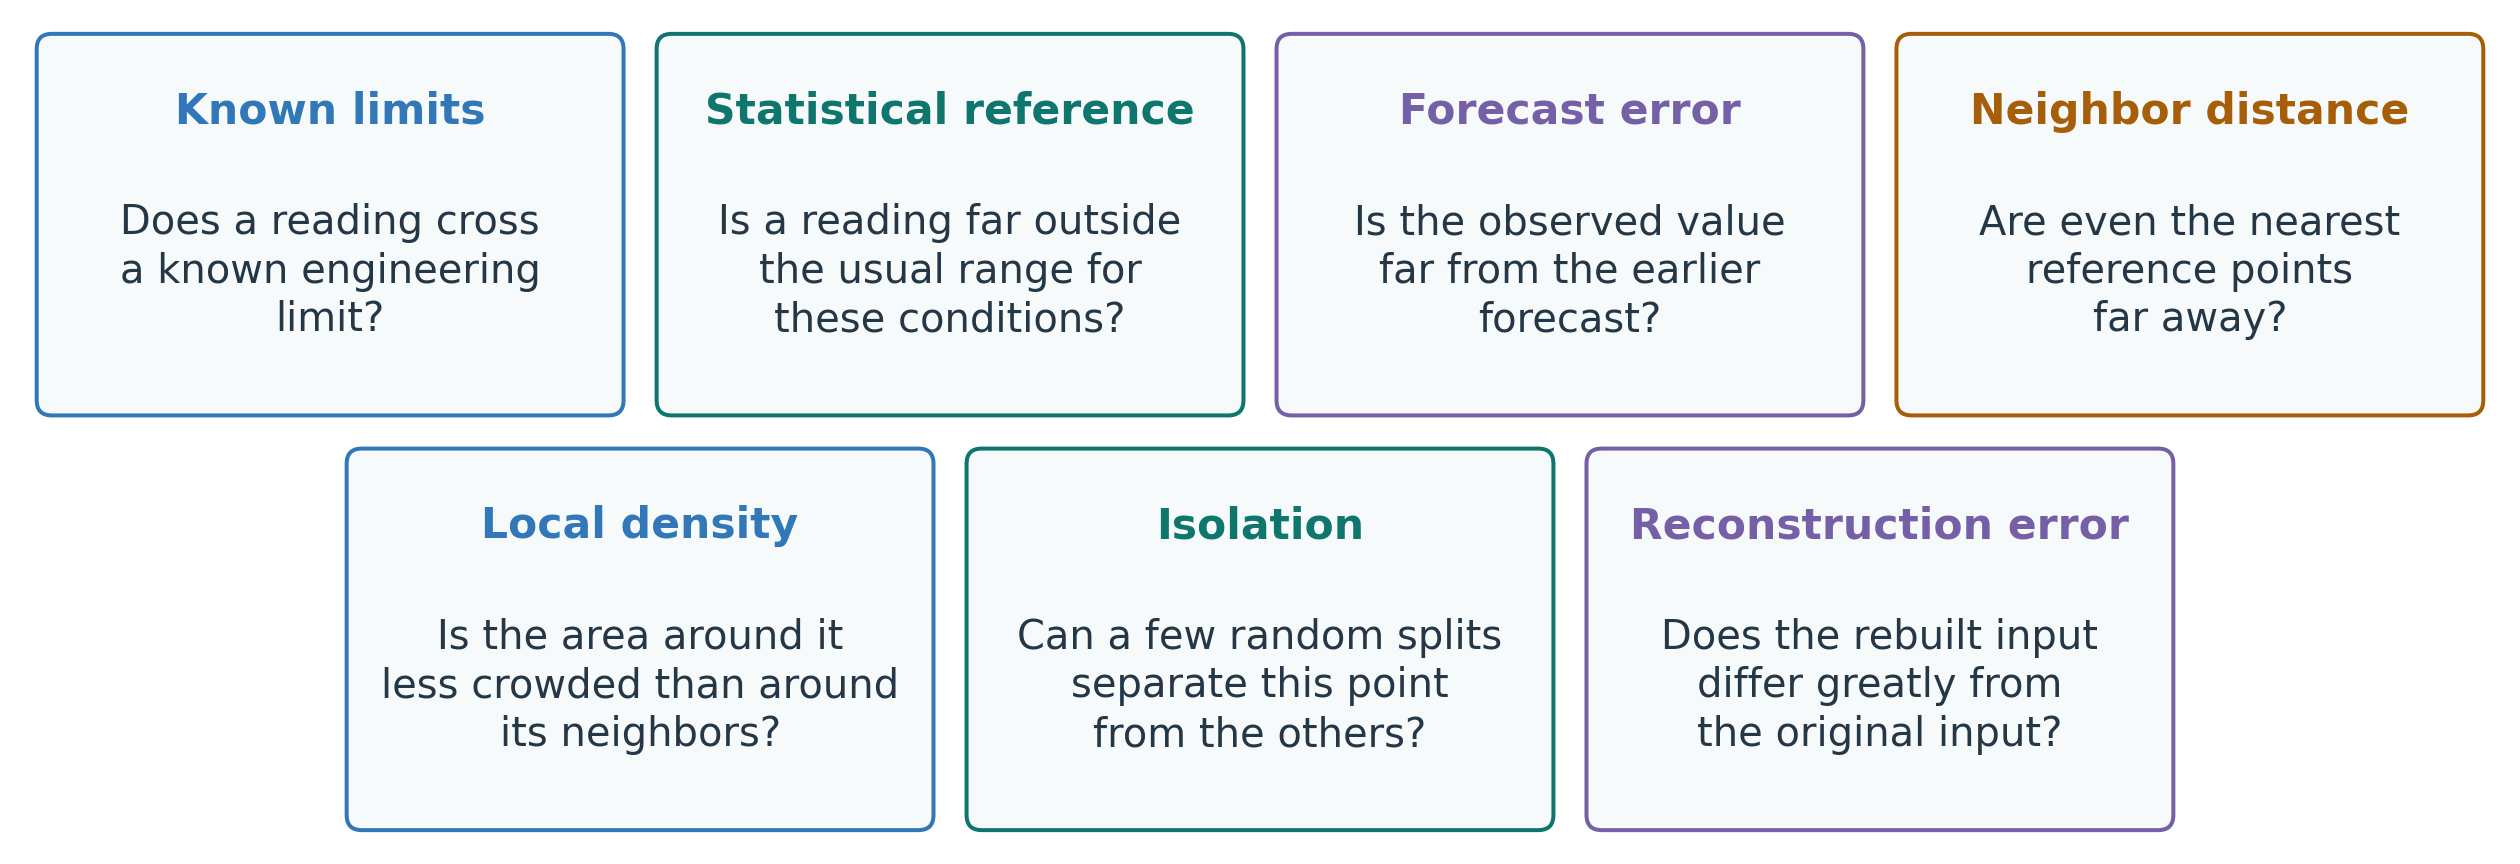
Each method checks a different kind of departure from expected behavior. These questions follow the order of the next method slides.
Figure 29. Questions used to check whether behavior is unusual.
II.C) Anomaly Detection MethodsRules: Alert Outside a Known Limit
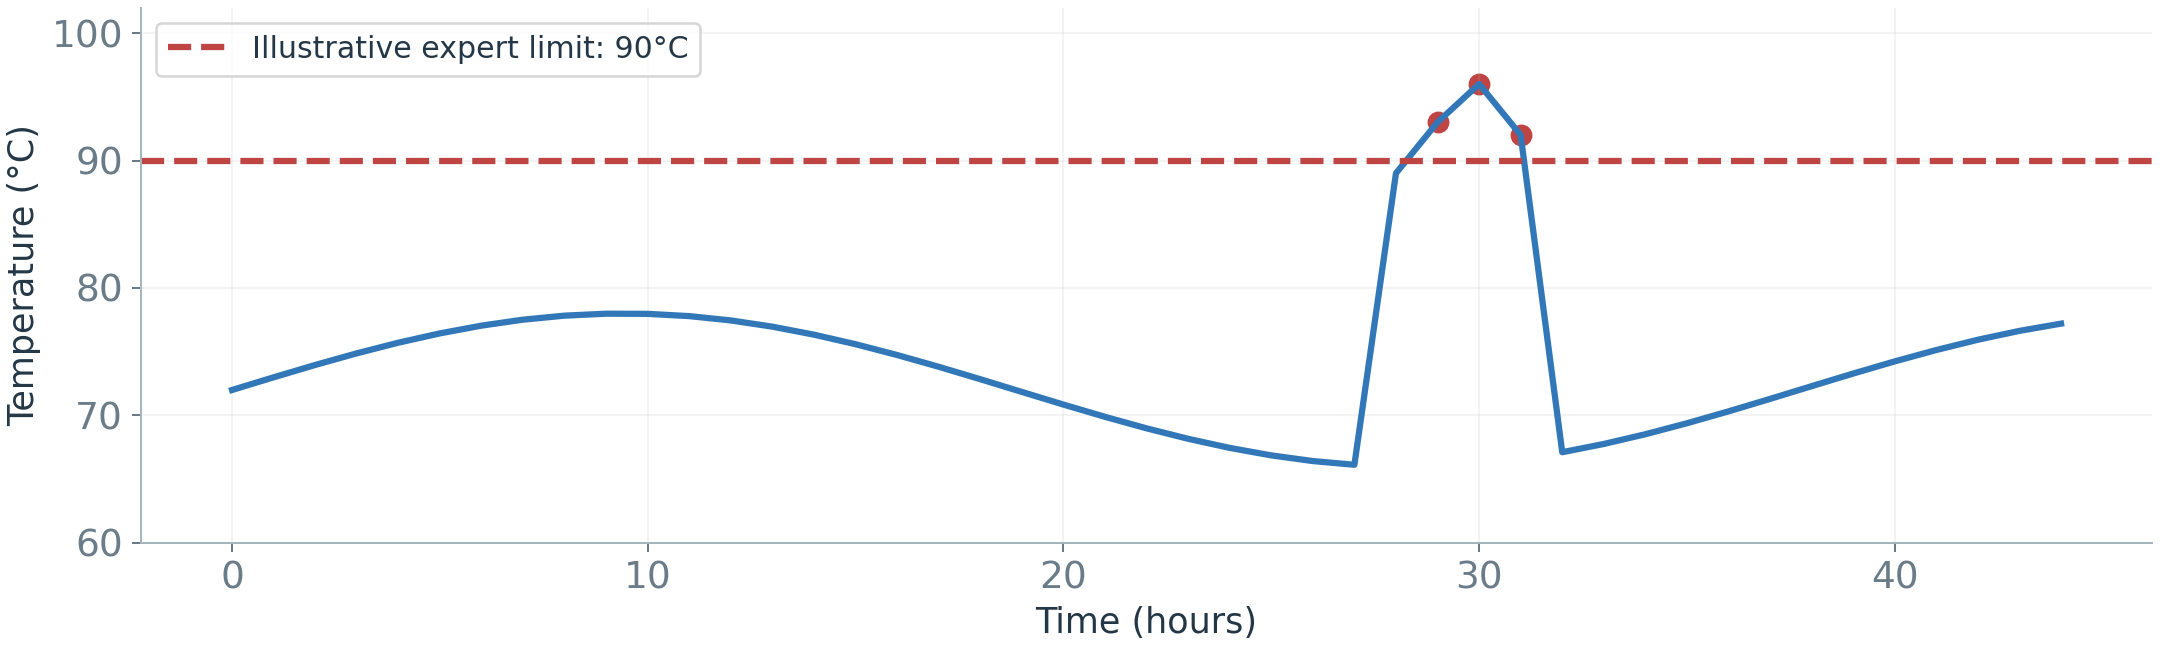
From the map: unusual means outside a limit. Example rule: temperature > 90°C → alert.
Strength: clear, fast, and easy to explain.
Limitation: a single limit may miss context or generate unnecessary alerts.
Use expert limits when they match the decision; do not treat them as a complete diagnosis.
Figure 30. An illustrative rule flags readings above a fixed limit.
II.C) Anomaly Detection MethodsStatistics: Far from the Expected Range
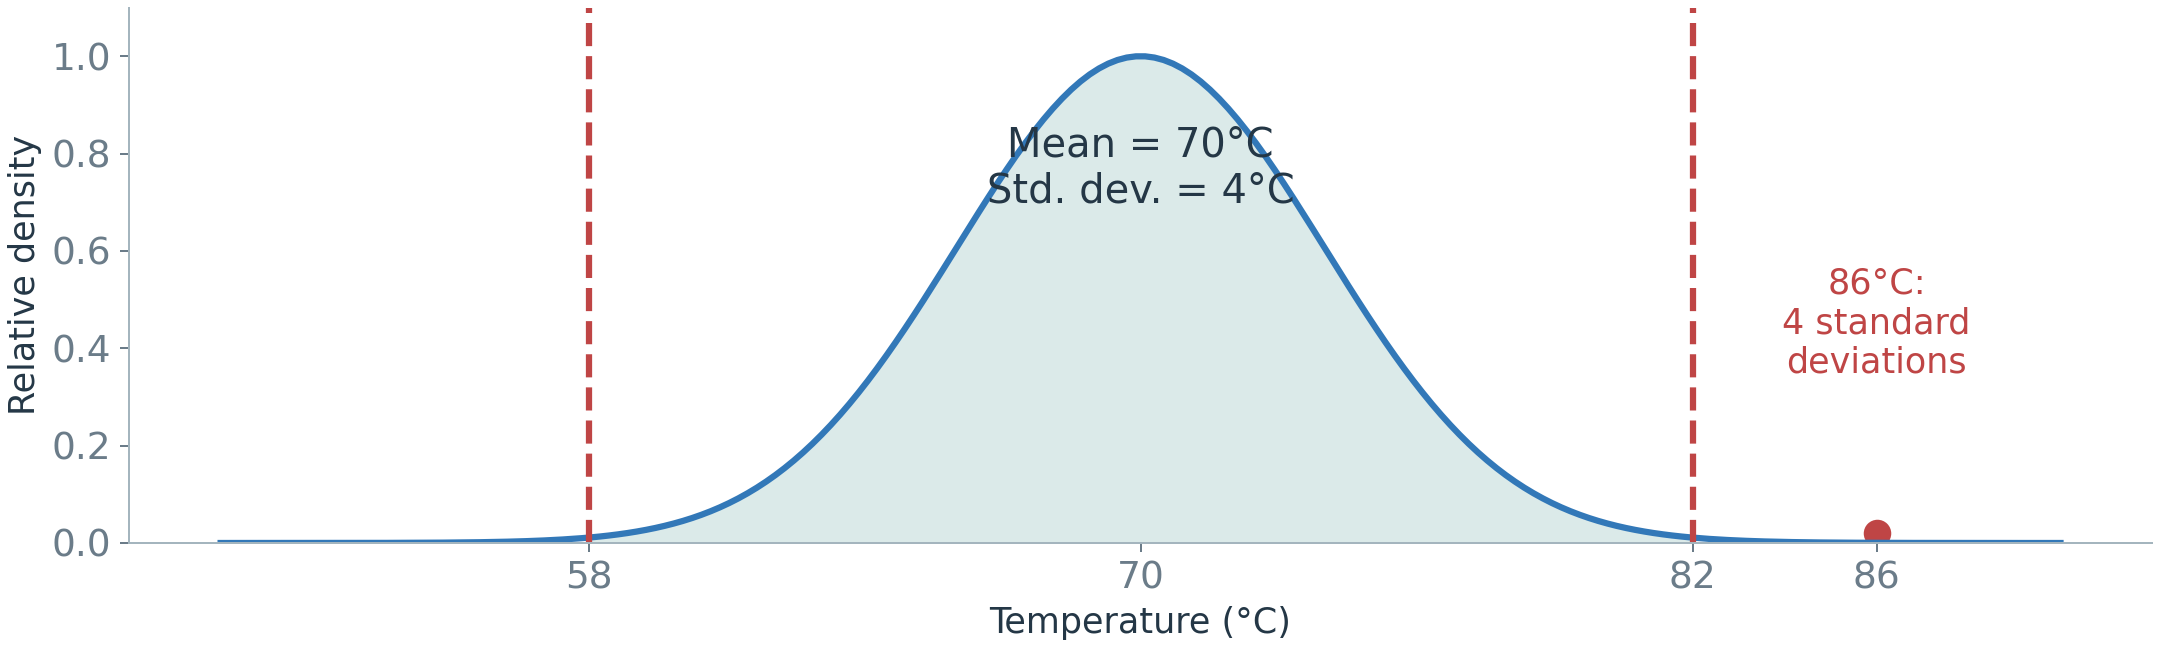
From the map: unusual means far from the expected range.Standard deviation measures spread around the mean of a suitable normal reference.
z=\frac{x-\mu}{\sigma}=\frac{86-70}{4}=4
x: reading; \mu: reference mean; \sigma: reference standard deviation. 86°C is 16°C above the mean, or four standard deviations.
Estimate the reference for comparable operating conditions. Lopsided (skewed) data and mixed regimes can make a single mean and spread misleading.
Figure 31. Mean ± 3 standard deviations is an illustrative rule.
II.C) Anomaly Detection MethodsPrediction: Compare Expected and Actual
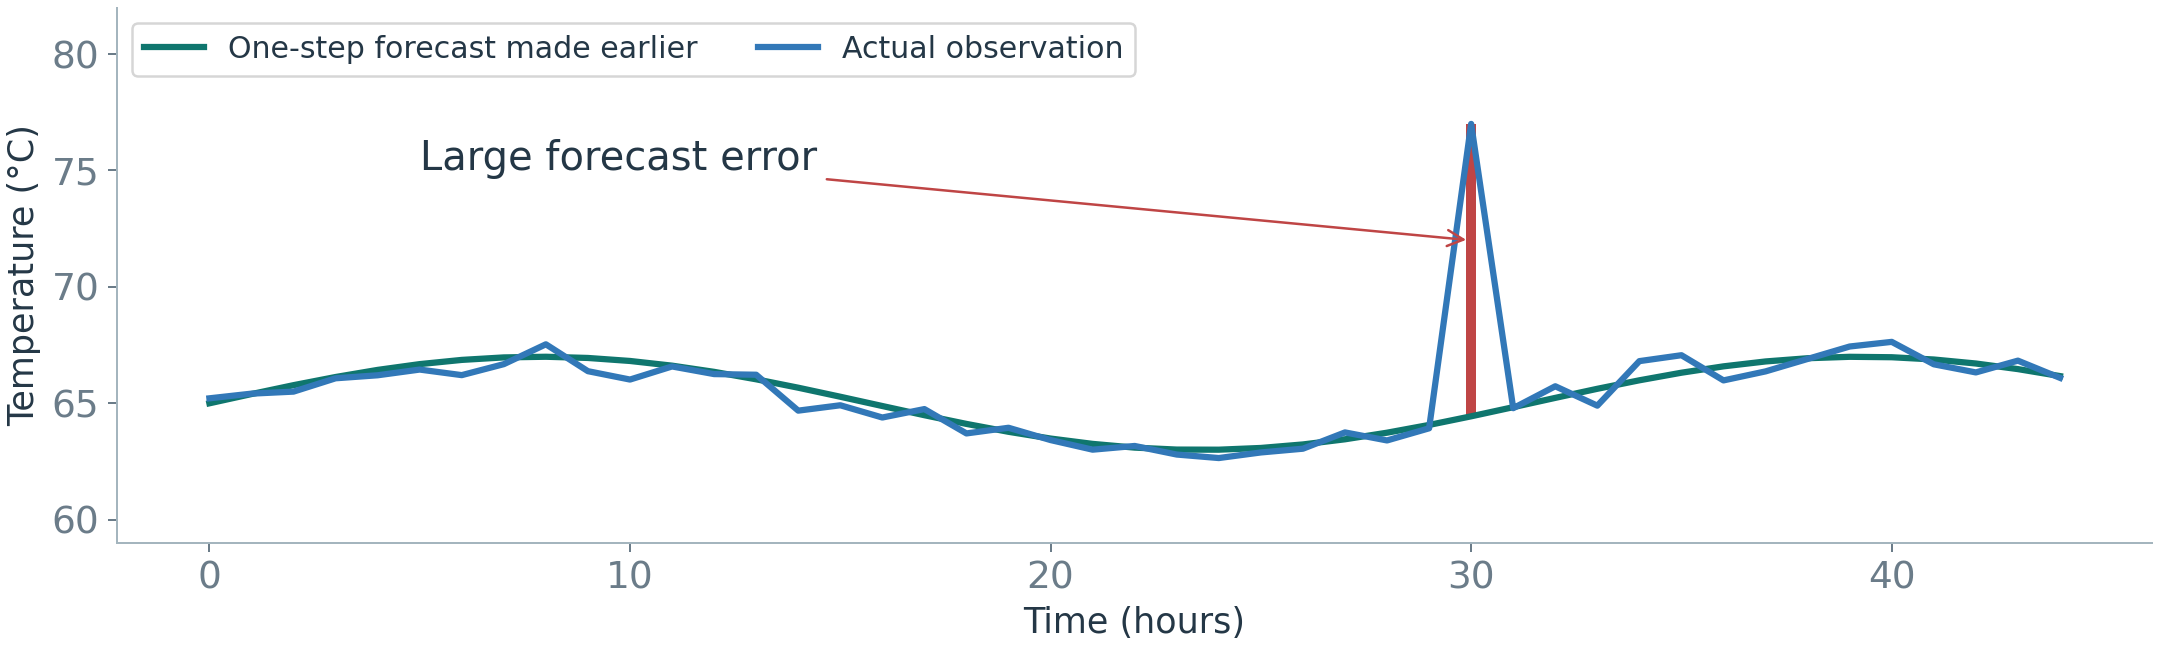
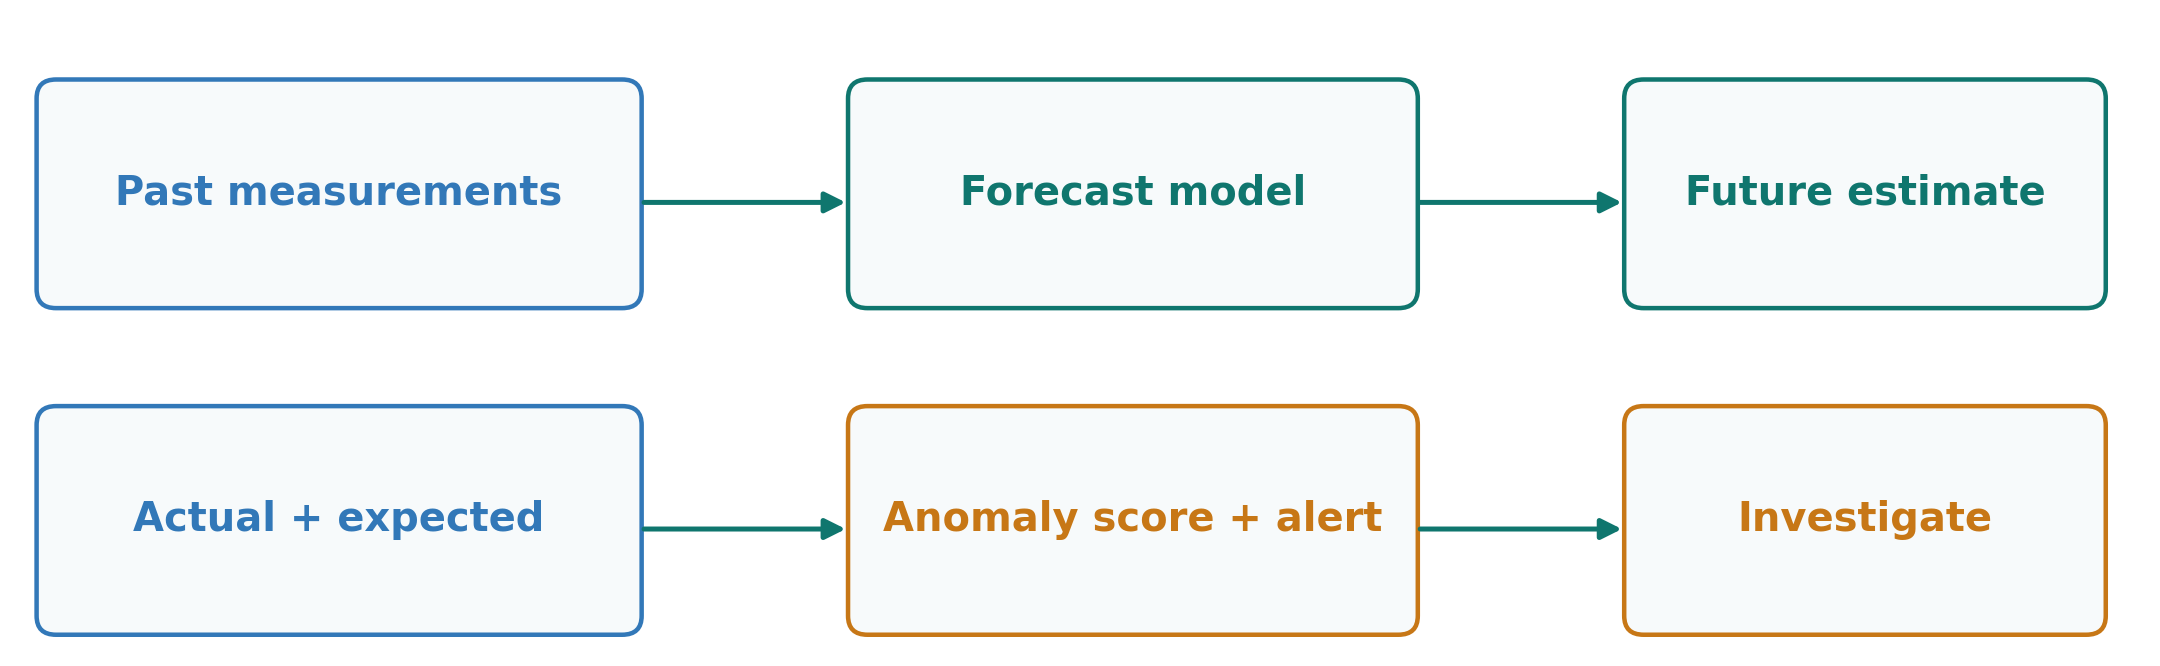
This connects detection to Part I: make a forecast, then compare it with the reading that arrives.
Forecast 70°C, actual 75°C: the absolute forecast error is 5°C. We can use that error as an anomaly score.
Figure 32. A forecast made earlier becomes the reference for checking a new reading.
Judge the error against usual forecast errors. A 5°C error is more unusual when typical errors are around 1°C than when they are around 5°C.
A poor forecast can cause a false alert. A large error alone does not prove a fault.
II.C) Anomaly Detection MethodsNeighbors: Is There Similar Data Nearby?
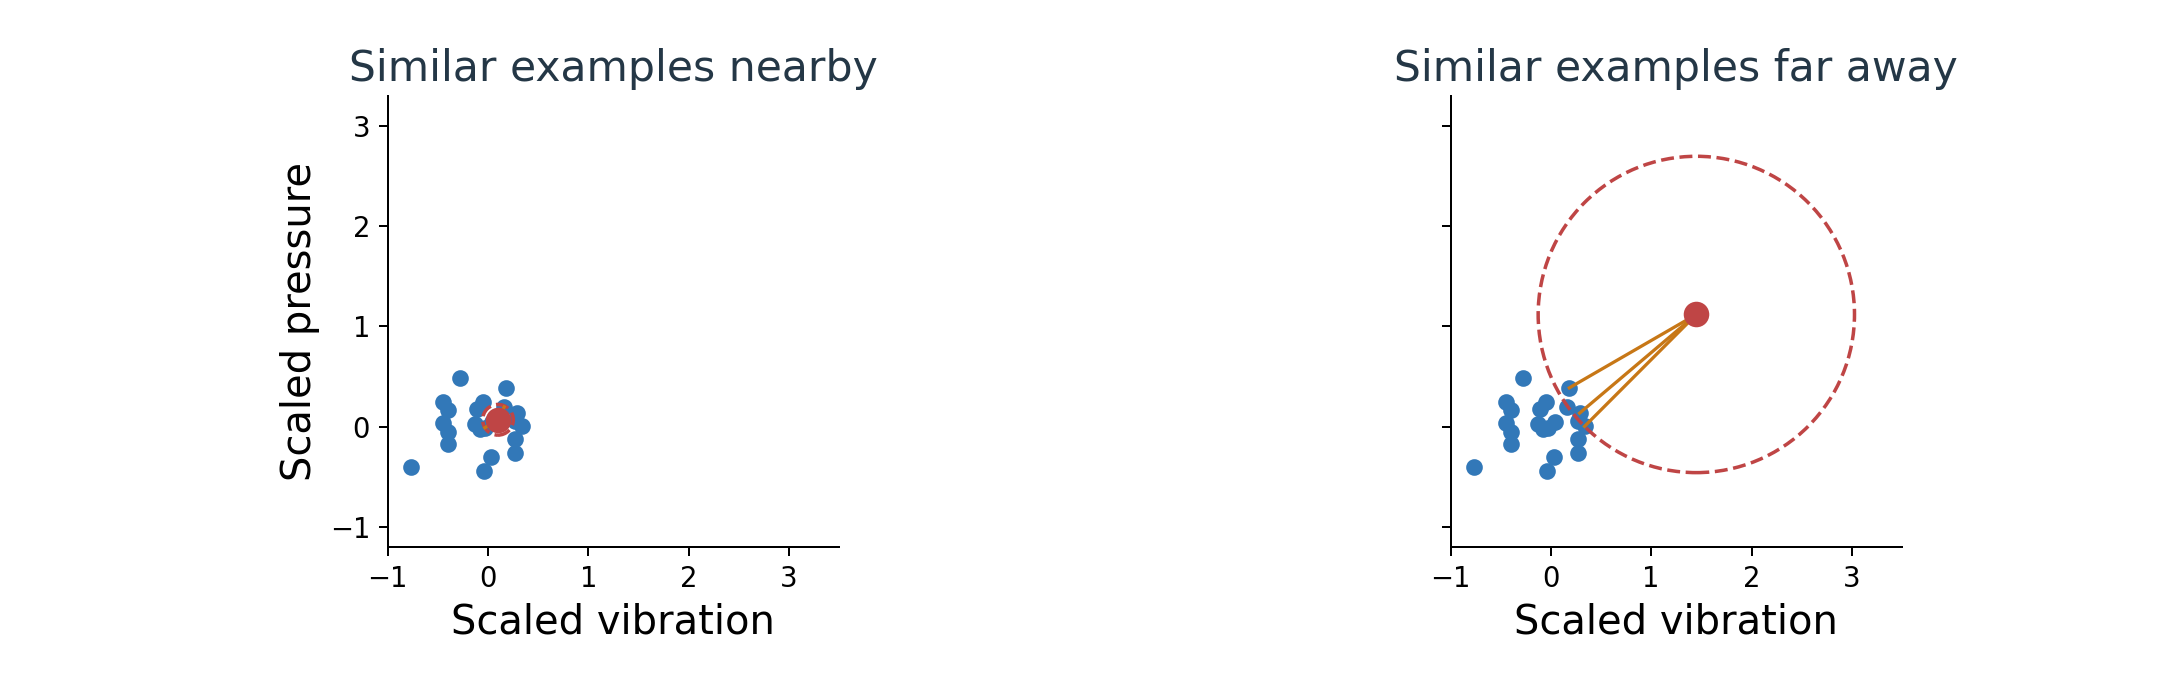
Idea: a reading looks unusual if similar examples are far away.
Each dot represents two measurements: blue = reference observations; red = a new observation.
k-nearest neighbors (kNN): choose a number of neighbors, k. Use the distance to the kth nearest reference point as the score. Here, k=3.
Figure 33. Compare the distance needed to reach three reference neighbors.
Make feature scales comparable first, so a large numerical unit does not dominate distance.
II.C) Anomaly Detection MethodsLocal Density: Unusual Compared with Which Neighbors?
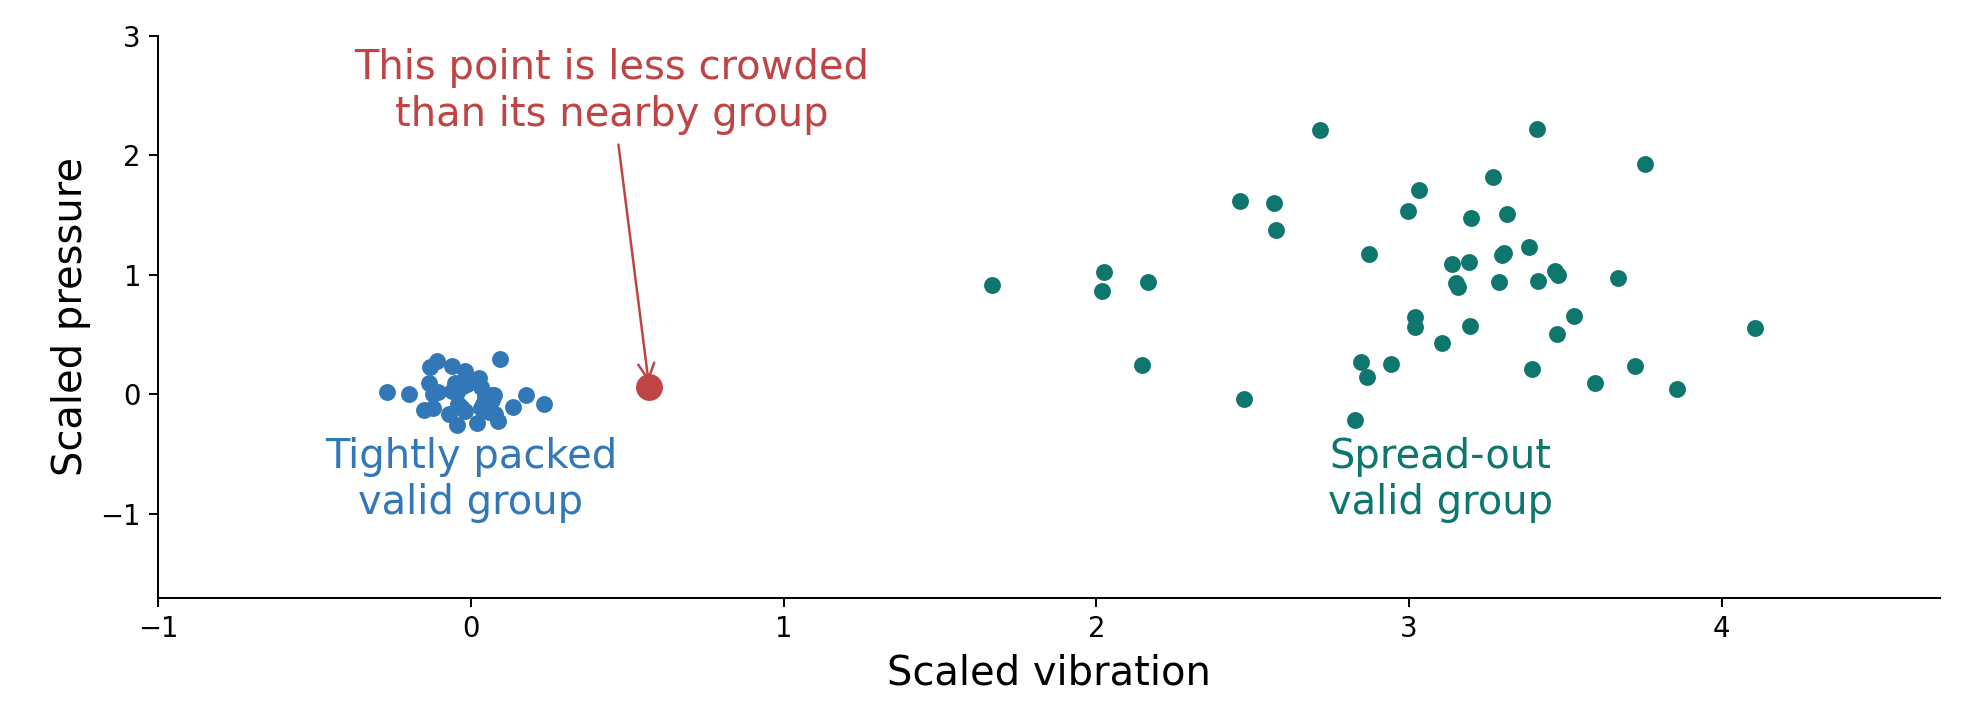
Distance alone can be misleading when one valid group is tightly packed and another is spread out.
Local Outlier Factor (LOF) asks: is this point in a less crowded area than its own neighbors?
Figure 34. A spread-out group can be normal; compare a point with its own neighborhood.
The comparison is local. A sparse group is not automatically a faulty group.
II.C) Anomaly Detection MethodsIsolation Forest: Easy to Separate?
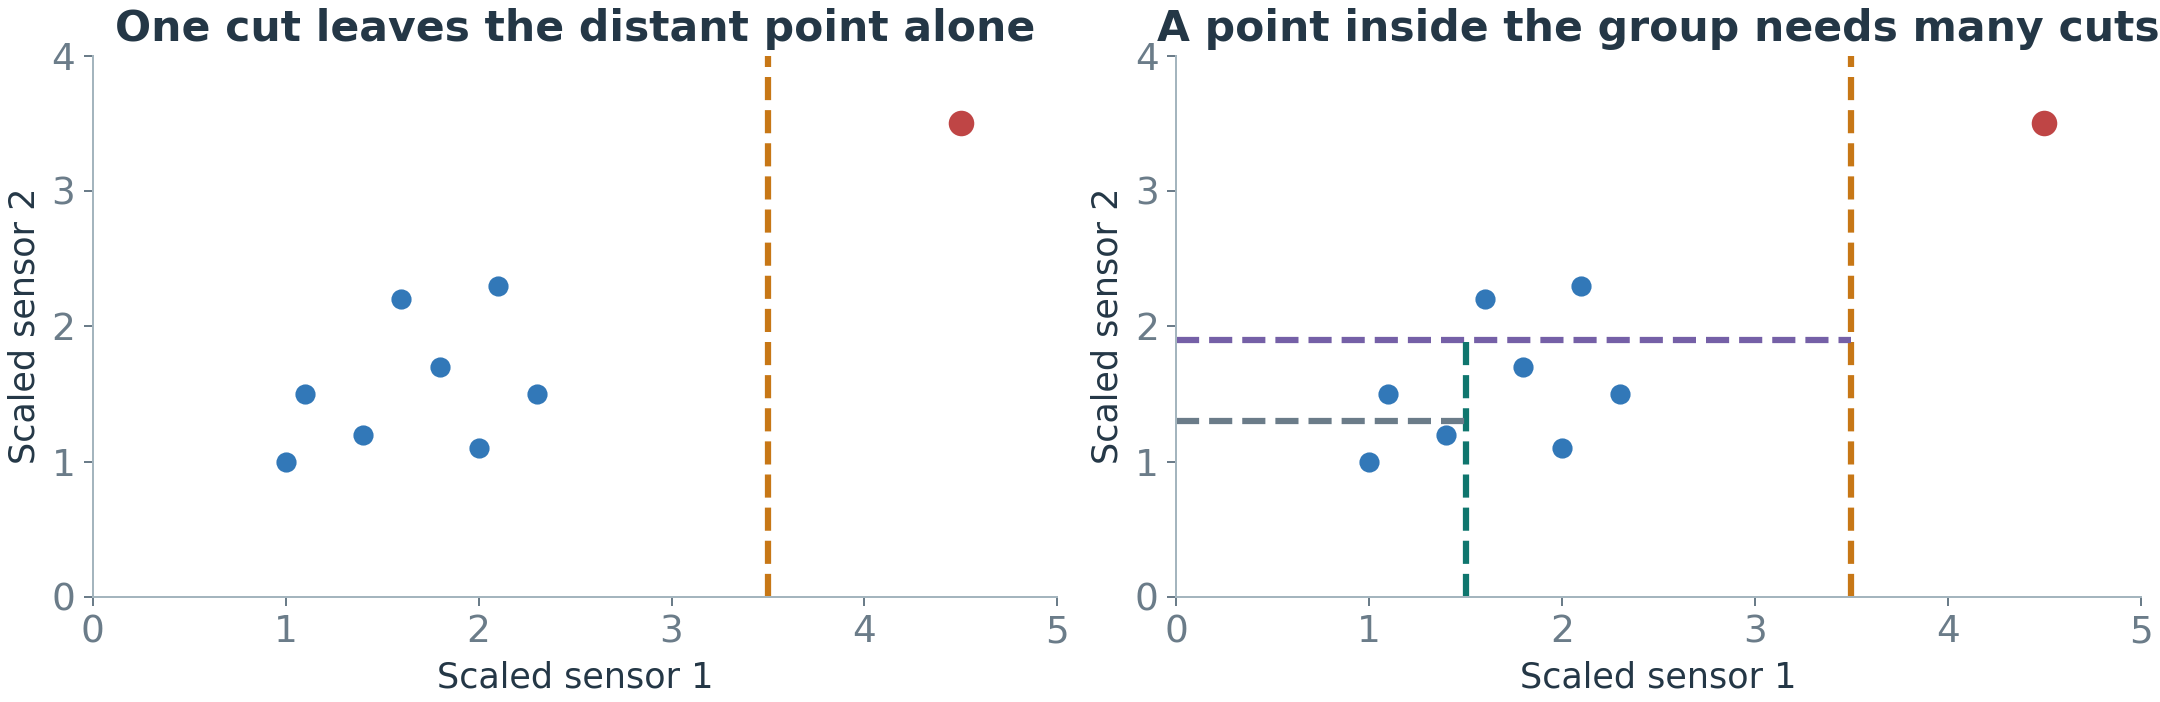
Idea: an unusual point is easy to separate from the rest.
Imagine cutting the data with random lines. Left: the red point is far from the others, so one cut is enough to leave it alone. Right: a blue point inside the group needs many cuts before it stands alone.
Isolation Forest repeats this with many random trees and averages: the fewer cuts a point needs, the more unusual it is.
It needs no labels and runs fast. Two limits: it does not see time order, and useless input features weaken it.
Figure 35. One illustrative tree; a forest repeats the random process.
II.C) Anomaly Detection MethodsReconstruction: Can We Rebuild the Input?
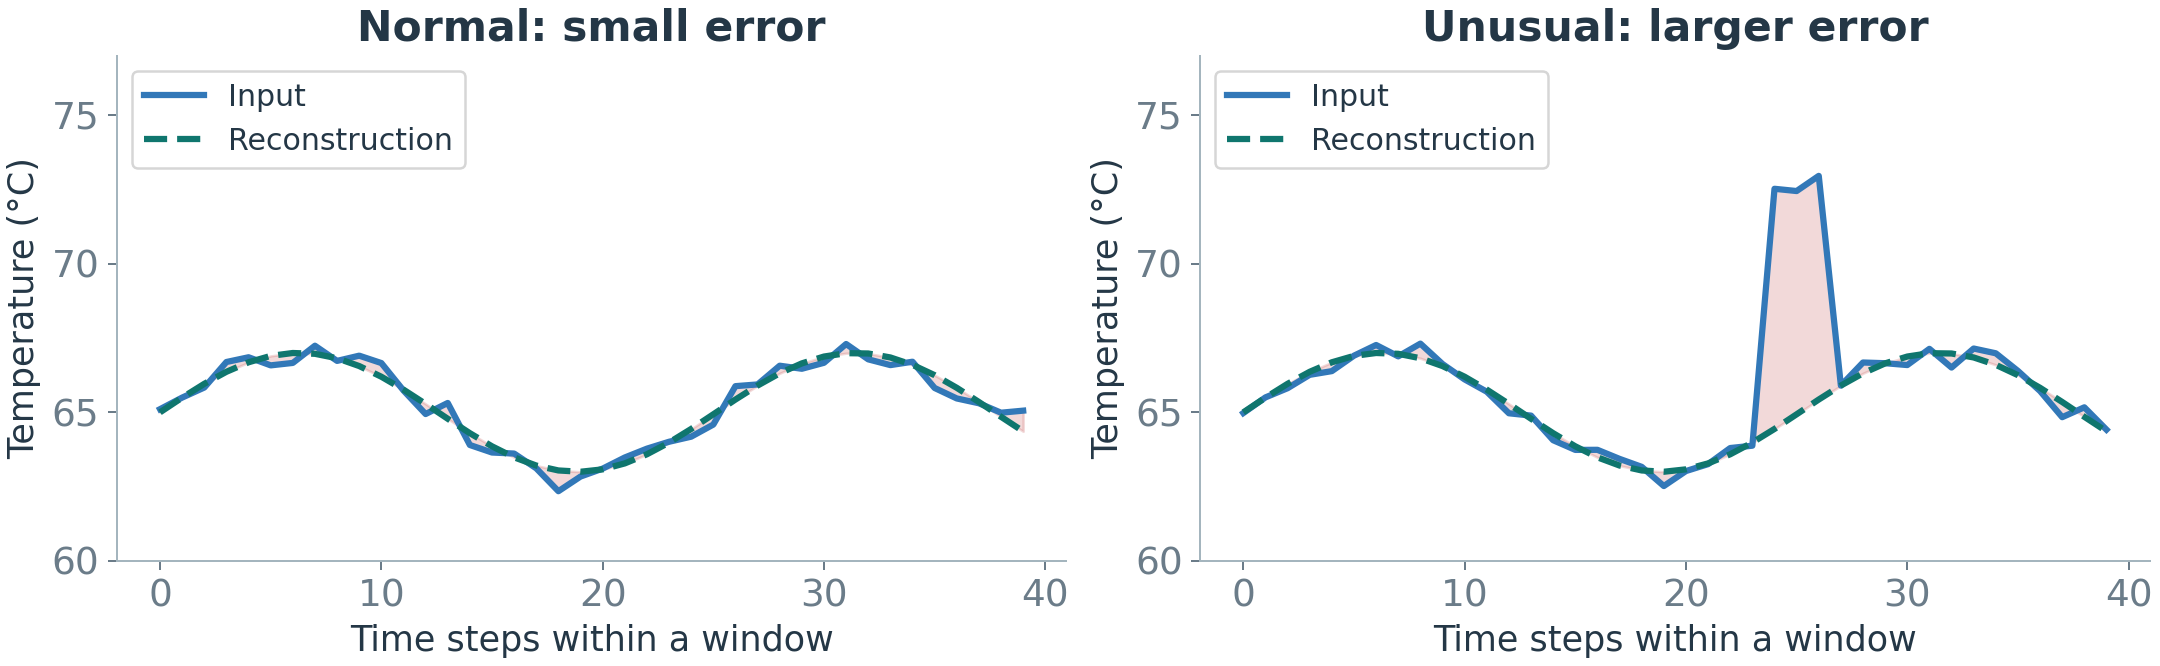
Reconstruction rebuilds a supplied input. Forecasting estimates a future reading.
An autoencoder learns to compress an input and rebuild it.
Train it on trusted normal examples. Then compare a new input with its reconstruction.
Figure 36. Compare the observed window with the model’s reconstruction of that same window.
Use reconstruction error as a score. Large errors suggest unusual patterns, but some anomalies can also be rebuilt well.
II.D) Evaluating Anomaly DetectionEvaluation Roadmap: Three Questions
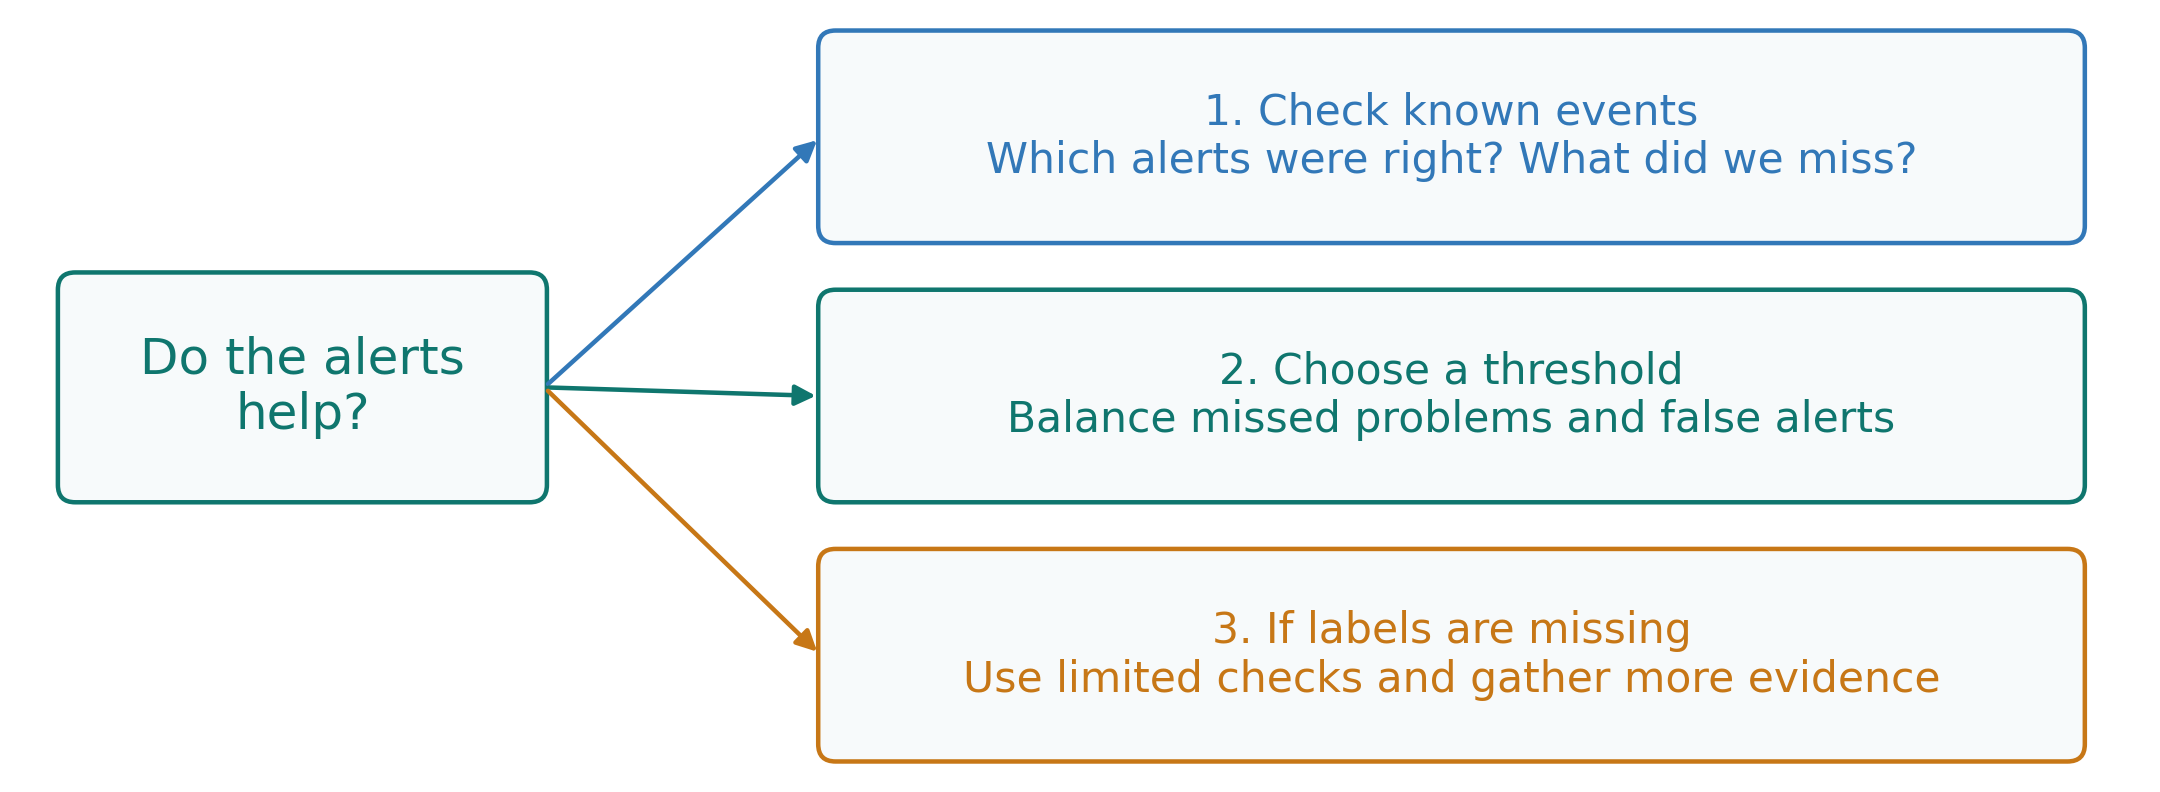
We have turned unusual behavior into alerts. Do those alerts help us find real problems?
We will answer three questions:
Figure 37. Evaluate whether alerts find problems, then choose settings that suit the task.
Use a labeled test period when available. Without labels, the evidence is more limited.
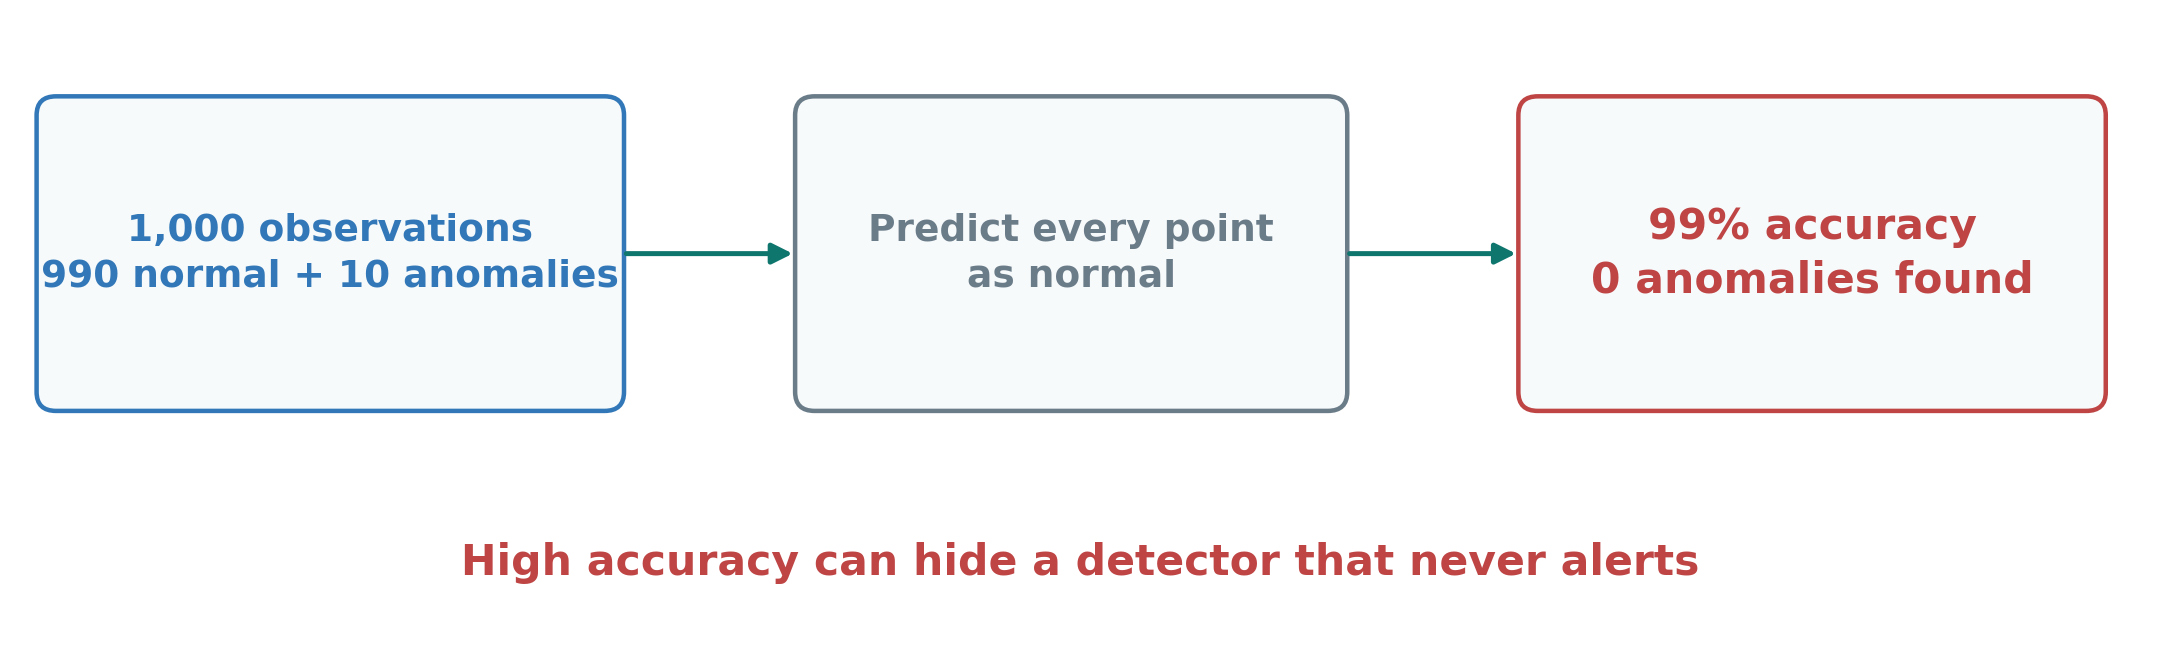
II.D) Evaluating Anomaly DetectionClass Imbalance: Why 99% Accuracy Can Be Misleading
A detector predicts normal for every observation.
Its accuracy is 990 / 1,000 = 99%, but it finds none of the 10 anomalies.
Evaluate detected events and false alerts, not accuracy alone.
Figure 38. A high score can hide complete failure to detect anomalies.
II.D) Evaluating Anomaly DetectionPrecision and Recall: Counting Detection Outcomes
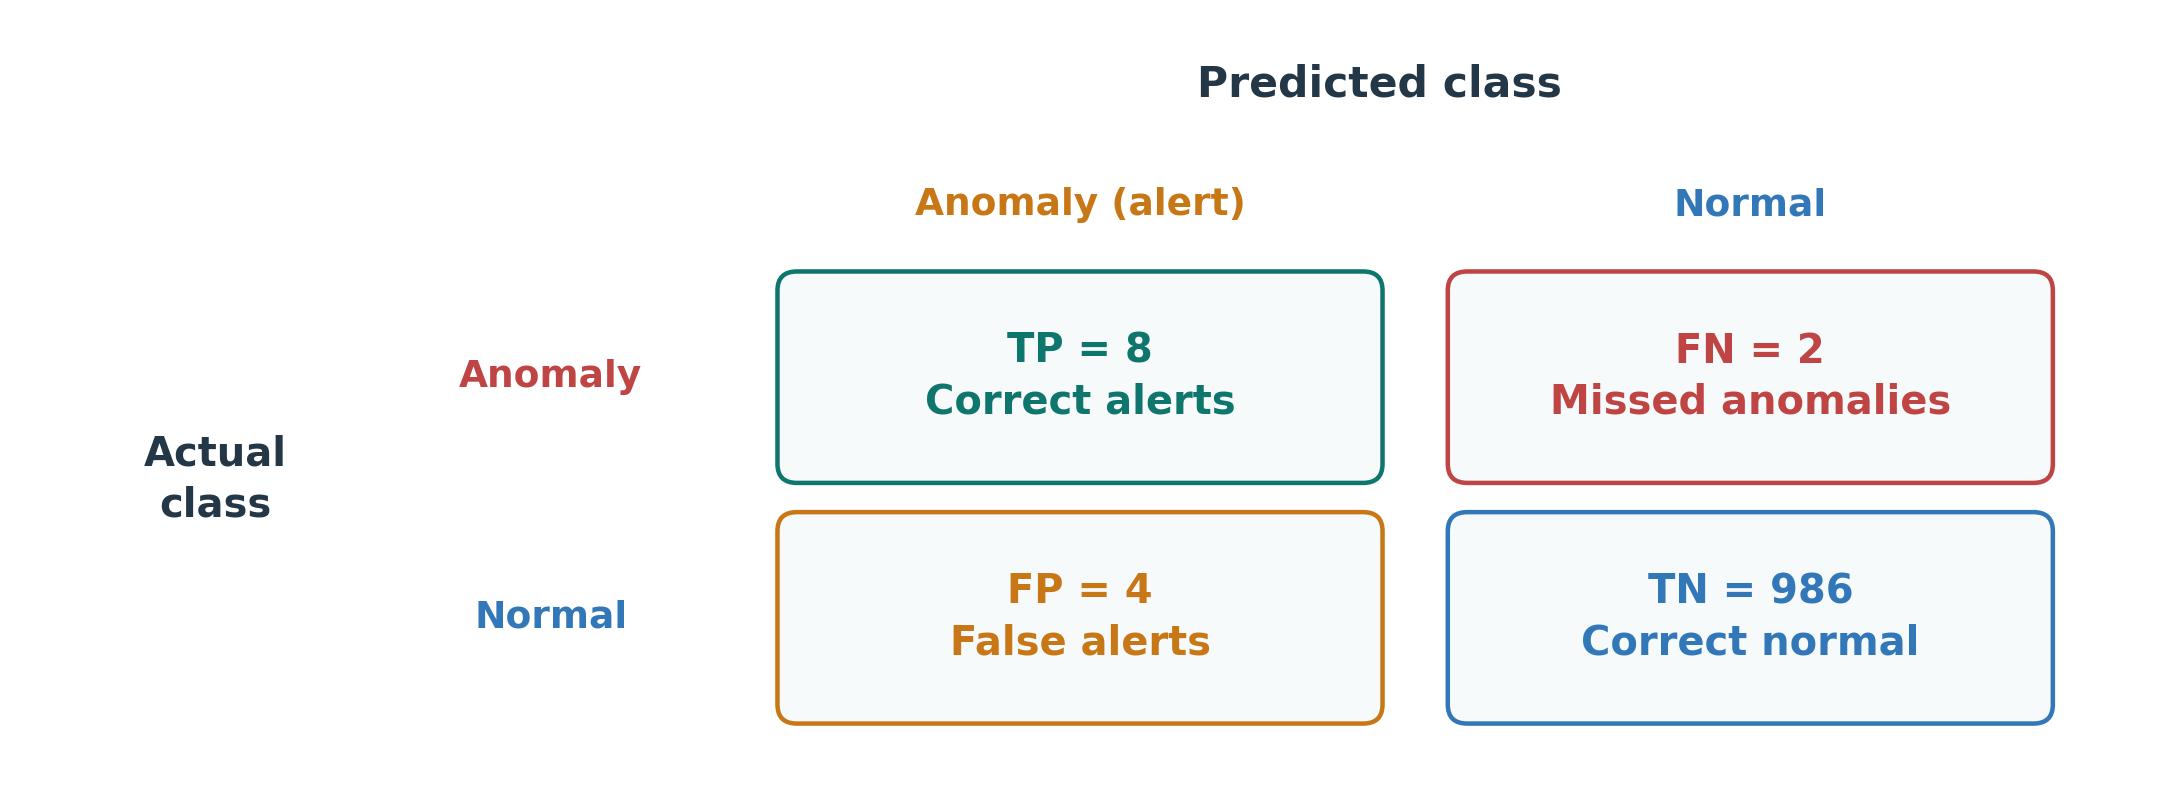
In a test period there were 10 anomalous readings. The detector raised 12 alerts: 8 correct and 4 false. It missed 2 anomalies.
Precision: of all alerts, how many were correct? 8 out of 12 = 66.7%.
Recall: of all anomalies, how many did we find? 8 out of 10 = 80%.
Figure 39. Correct alerts, false alerts, and missed anomalies answer different questions.
Precision describes alert reliability. Recall describes how many anomalies were found.
II.D) Evaluating Anomaly DetectionThreshold Selection: Balancing Misses and False Alerts
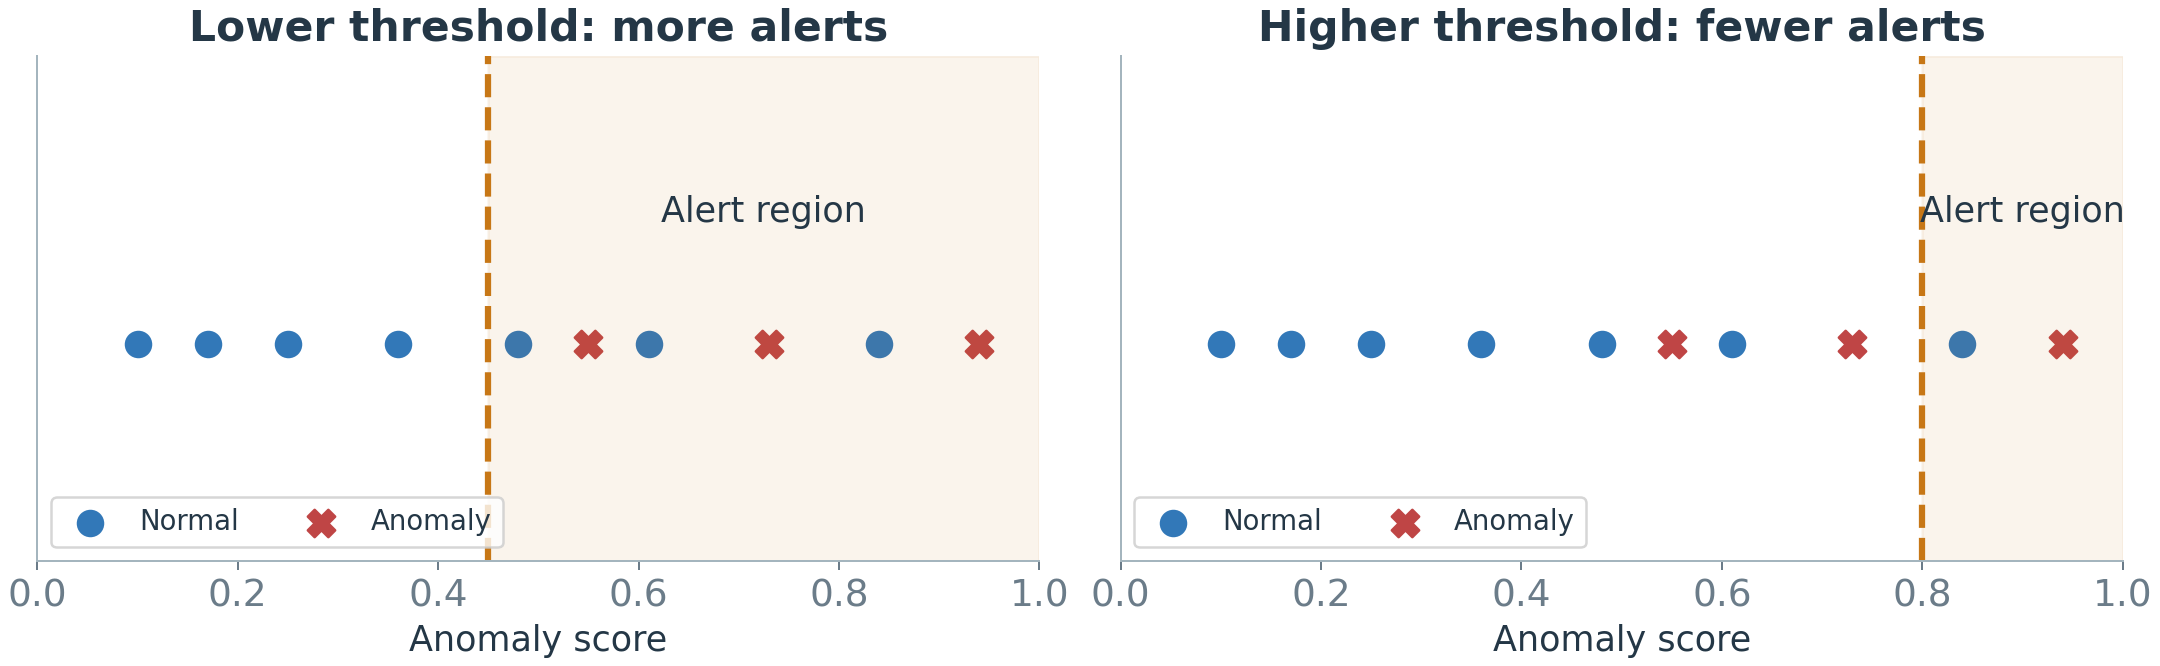
With a lower threshold, more readings raise alerts. This may catch more anomalies, but also creates more false alerts.
With a higher threshold, fewer readings raise alerts. Some anomalies may be missed.
Figure 40. Changing the threshold changes both correct detections and false alerts.
Choose on validation data: balance missed problems against false alerts and review capacity.
With only trusted normal data: a cutoff above 99% of those scores is one starting point. Check it later; it does not tell us how many anomalies will be missed.
II.D) Evaluating Anomaly DetectionEvaluation in Each Situation: What If Labels Are Missing?
Training labels and evaluation labels answer different questions. A detector trained without labels can still be checked against labeled test data.
Table 5. Match the strength of the conclusion to the available evidence.
Available test evidence
What we can check
Known anomalies and normal periods
Correct alerts, false alerts, missed anomalies, and detection delay
No reliable anomaly labels
Try artificial anomalies, ask experts to review alerts, and check behavior during trusted normal periods
Without known events, we cannot measure recall. Artificial anomalies test only the patterns we create; reviewed alerts do not reveal every missed event.
II.E) Monitoring in PracticeAnomaly or Drift: Investigating Persistent Change
Evaluation used recorded data. Now the detector runs every day, and daily operation brings new questions.
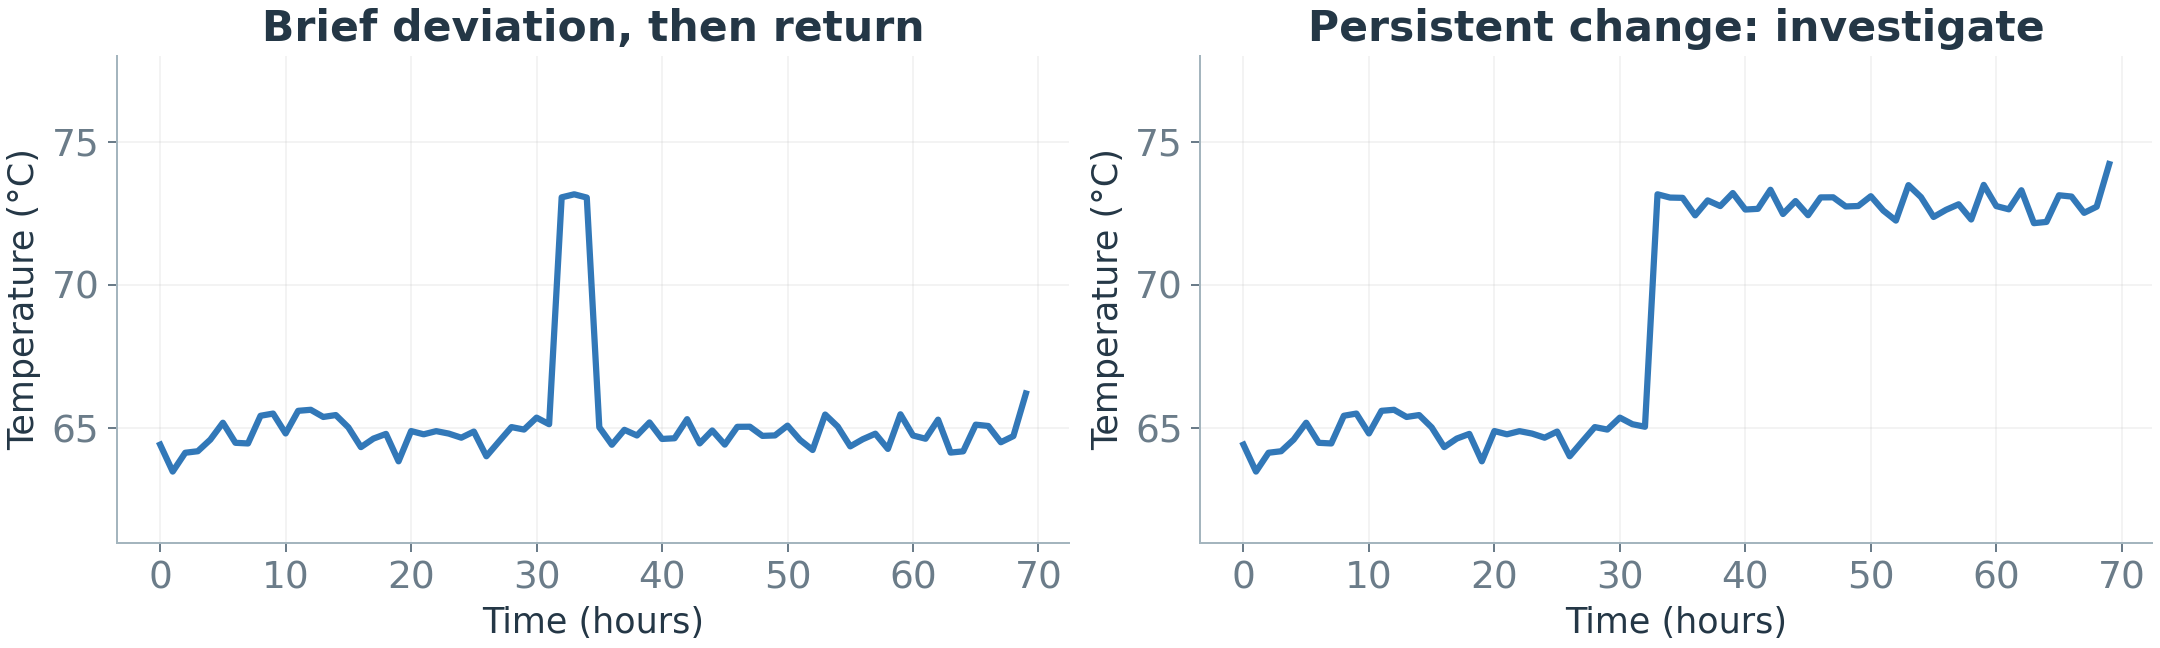
A brief spike may be an isolated anomaly. A persistent deviation may indicate a new regime, drift, a sensor issue, or an ongoing fault.
Duration is a clue, not a diagnosis. A persistent fault remains important even if it becomes common.
Before accepting a change as the new normal, check the operating conditions and whether the input-target relationship really changed.
Figure 41. A change in the trace does not reveal its cause.
II.E) Monitoring in PracticeOnline Detection: Score Data as They Arrive
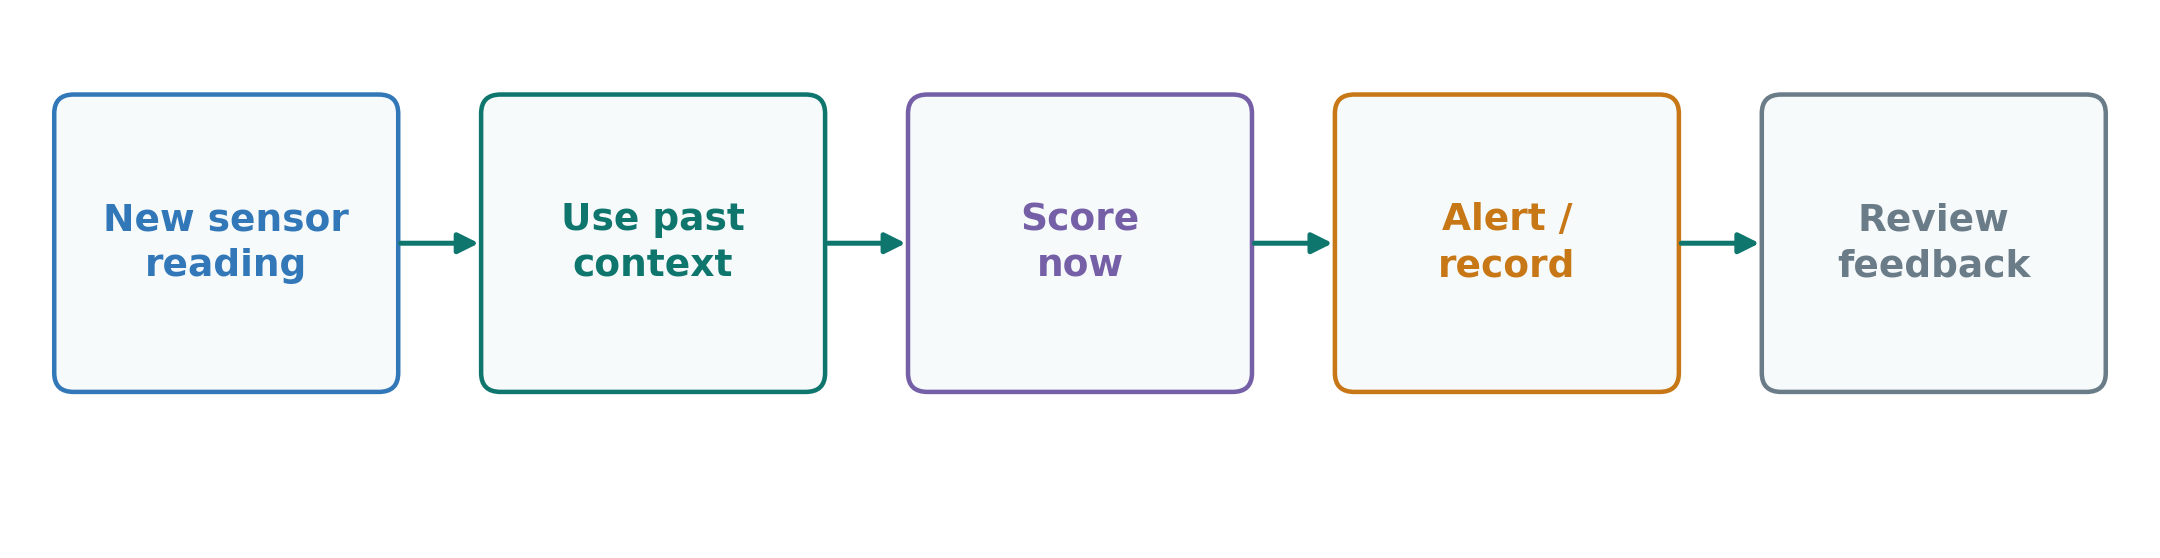
So far we scored recorded data. In operation, readings arrive one by one.
Offline: analyze a collected dataset later. Online: evaluate each new reading or short window as it arrives.
Meet the required response time while controlling false alerts. Online detection does not necessarily mean online model training.
Figure 42. Streaming evaluation can use a fixed or periodically updated model.
II.E) Monitoring in PracticeAlert Explanations: Showing Evidence for Investigation
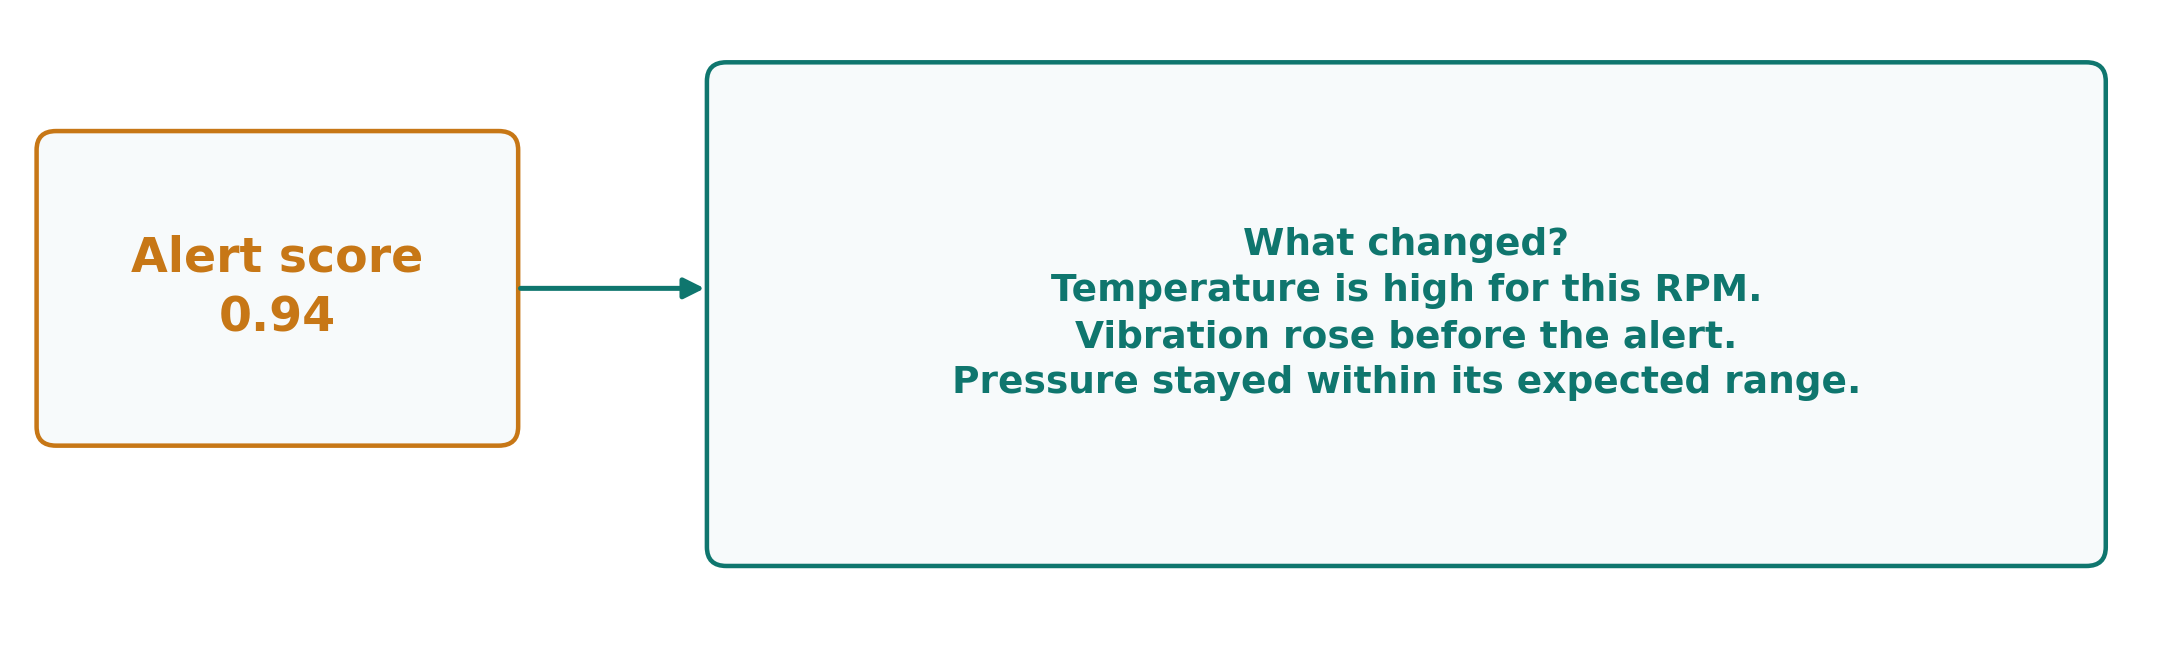
An alert has fired. What does the engineer see next?
For an alert score of 0.94, ask: what changed, when, and under which conditions?
Show expected versus observed behavior and the sensors contributing most to the discrepancy.
An explanation supports investigation; it does not prove a root cause.
Figure 43. Translate an alert into evidence an engineer can examine.
II.E) Monitoring in PracticeHuman Review: Recording Findings and Improving Detection
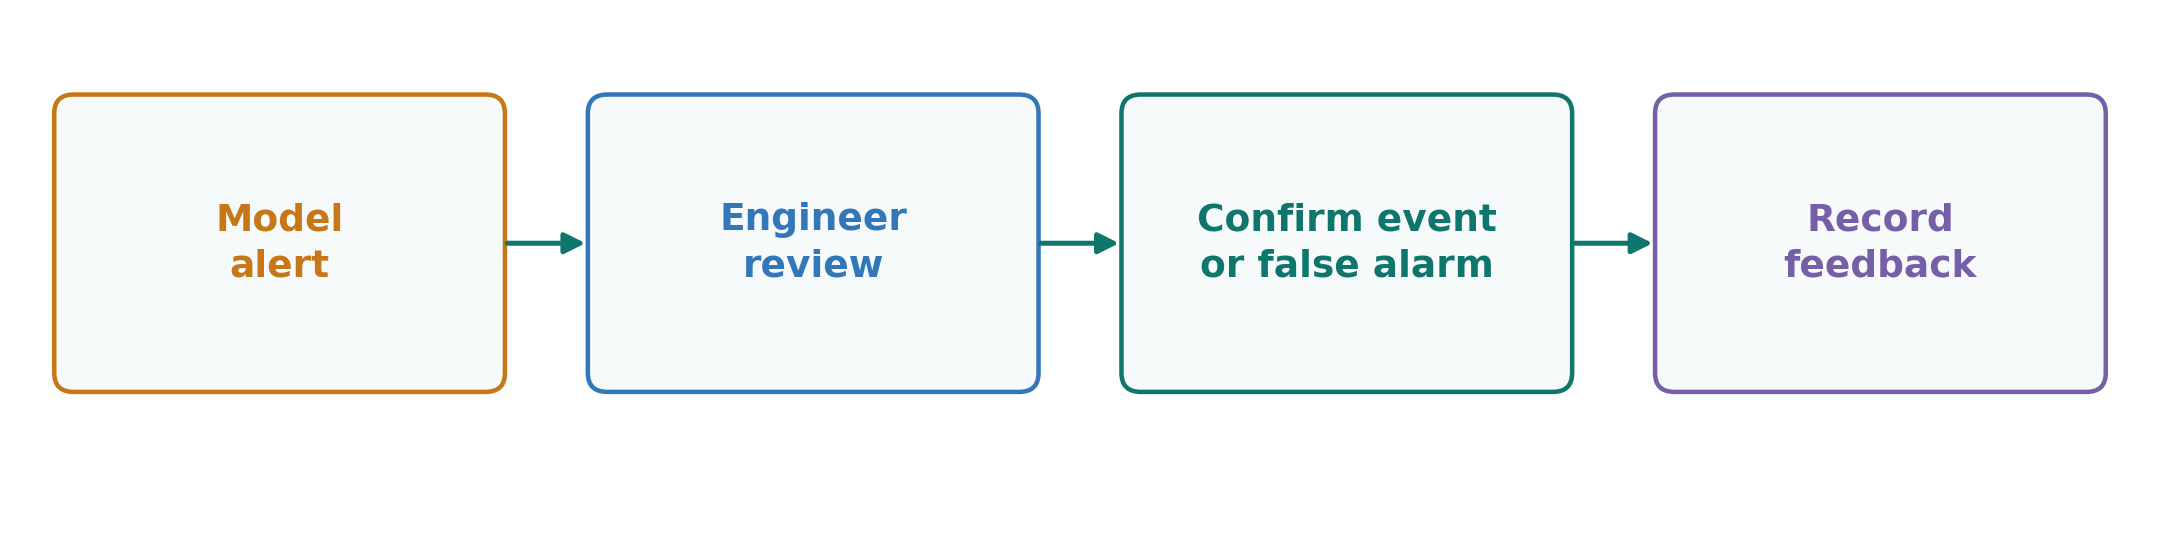
The last step of daily monitoring is human judgment. An engineer reviews the alert, checks context, and records what was found.
Useful feedback distinguishes a fault, a sensor problem, a valid event, and an unresolved case.
Use reviewed feedback to improve thresholds and training data. An unreviewed alert is not a confirmed anomaly label.
Figure 44. Detection and human review have different responsibilities.
II.F) From Detection to DecisionsMethod Selection: Choosing a Suitable Starting Point
Which method should you start with? Ask what evidence you have. Find your row, start there, then test on later data.
Table 6. Match the evidence you have with a starting method.
What you have
Start with
Be careful
Safe limits from engineering knowledge
A fixed rule
It cannot see context
Examples labeled normal and fault
A supervised classifier
New faults it has never seen
A stable, confirmed healthy period
Statistics: mean and spread
Conditions that change over time
Many trusted normal examples
Neighbors: kNN or LOF
Scale features, choose k carefully
Mostly normal rows, no labels
Isolation Forest
It cannot see time order
Trusted windows of normal readings
An autoencoder
It may rebuild anomalies well too
A forecast you can trust
Forecast error as the score
A poor forecast creates false alerts
These are starting points, not final answers. Whatever you pick, compare it with a simple baseline on the same later events.
II.F) From Detection to DecisionsDetection, Diagnosis, and Prognostics: Different Questions
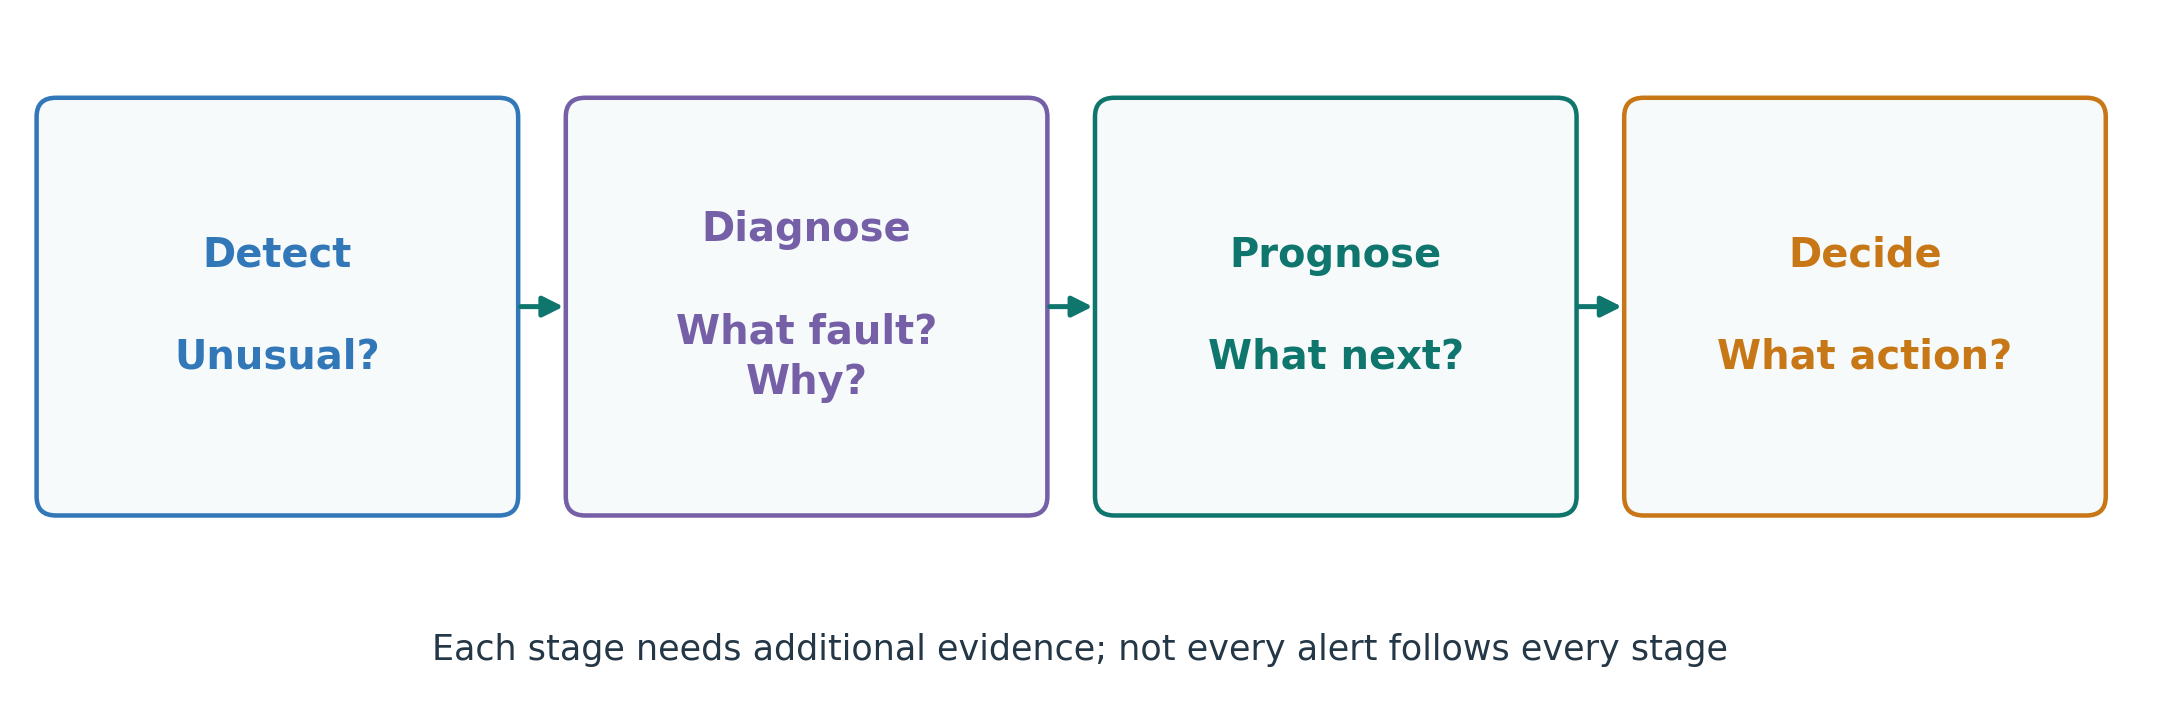
Detection found something. What happens after an alert?
Detection: something differs from expectation.
Diagnosis / root-cause analysis: what fault occurred, and why?
Prognostics: how might the condition develop, or when might failure occur?
An action needs evidence, operating constraints, and human responsibility.
Figure 45. Later stages need evidence beyond an anomaly score.
Week 4: SummaryExpected Behavior Connects Both Tasks
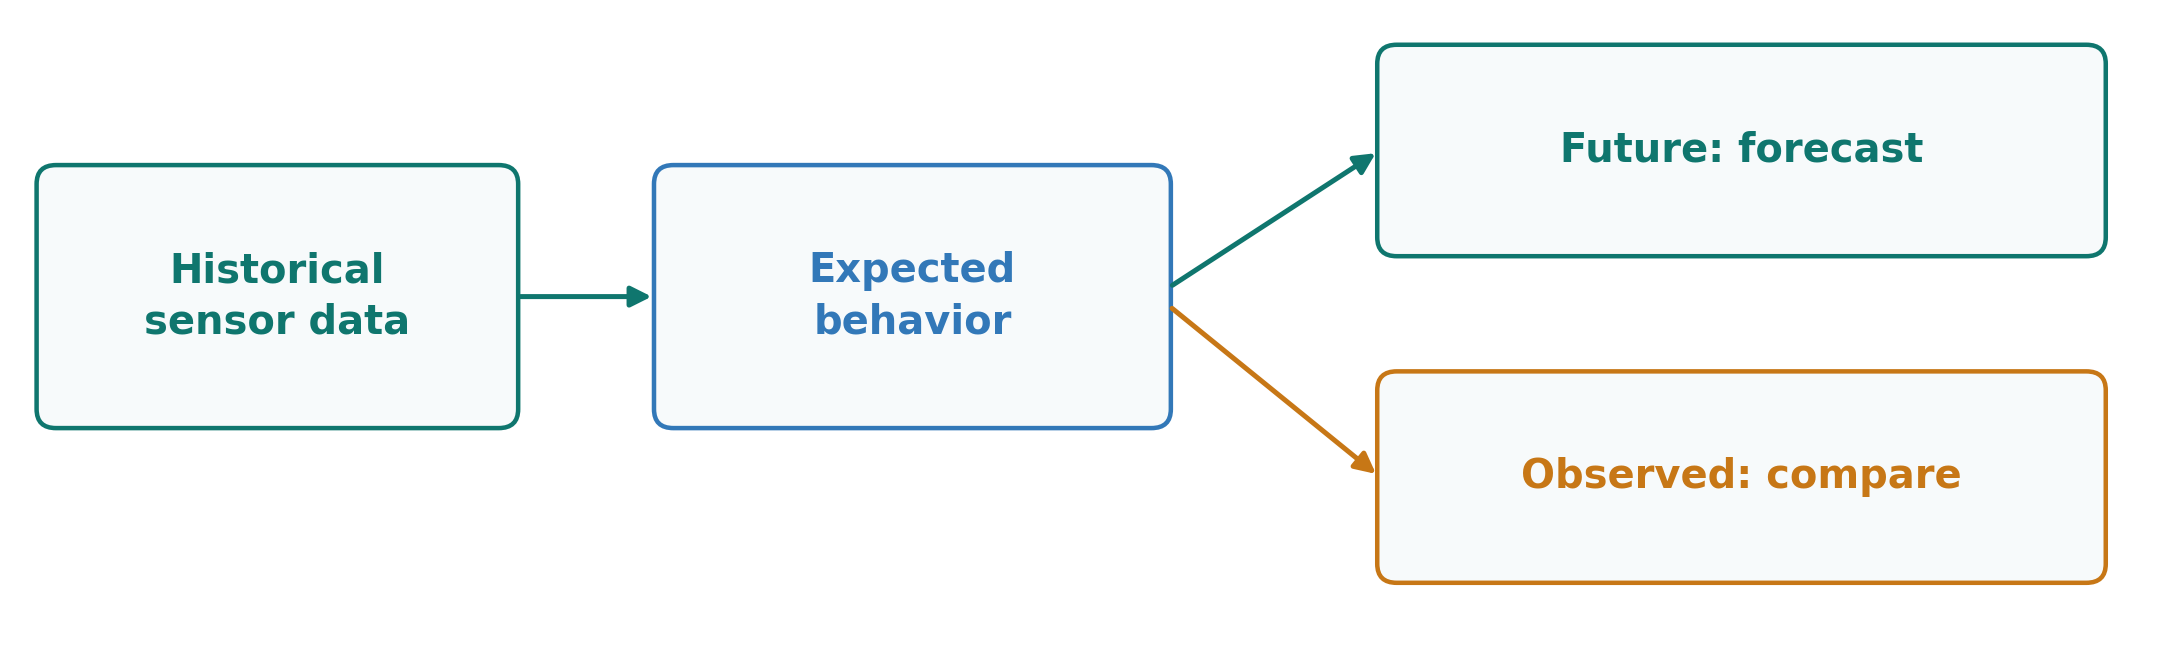
Forecasting: what should happen next? Anomaly detection: is what happened consistent with what we expected?
Use honest temporal evaluation, meaningful thresholds, and monitoring for change.
A prediction or alert is useful when it supports a better decision.
Figure 46. Two questions built on an appropriate expectation.